
Circular Chart Samples
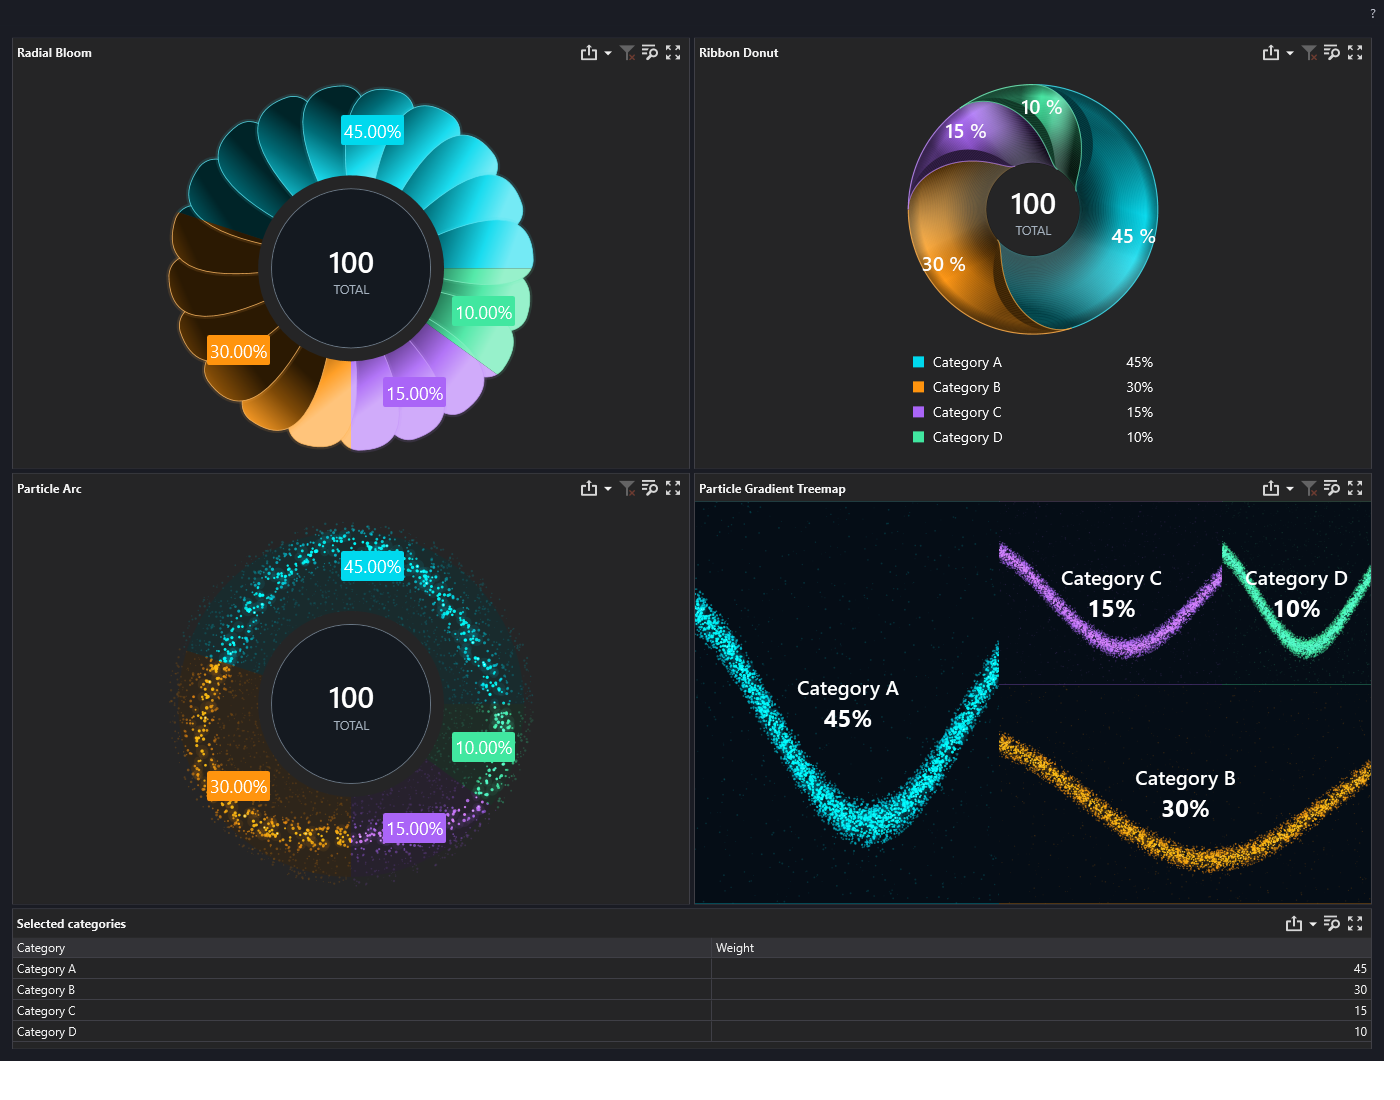
This experimental Dashboard compares four first-pass interpretations of the supplied artwork: Radial Bloom, Ribbon Donut, Particle Arc and Particle Gradient Treemap. It uses illustrative Category A/B/C/D weights of 45, 30, 15 and 10. These are not collected server measurements.
Reading the Samples
The three circular panels use native DevExpress Dashboard items and source values. Radial Bloom and Particle Arc keep the native slice angles and use custom point templates. Ribbon Donut paints curved category surfaces above its native item, using the same category weights; selecting the actual curved surface filters the linked Dashboard data. The total in the center is the sum of the weights, not an additional category. The legend identifies each category and its share. The treemap uses native value-sized cells: Category A occupies 45 percent of the area, B 30 percent, C 15 percent and D 10 percent.
Radial Bloom paints overlapping-looking petals within the native category slices. Ribbon Donut rotates the inner edges of each category relative to its outer edges, creating curved boundaries and folded lighting rather than straight pie wedges with a texture. Select a ribbon to filter the linked grid; select it again to clear that selection. The center opening is not a category. They are visual treatments, not new statistical measures. Petal counts, highlights and apparent depth do not represent extra values. Use the labels and category shares for numerical comparisons, not the amount of glow.
Ribbon's fold study uses ends that turn along the rims and tapered underside strips to distinguish each tuck. Its surface lighting remains provisional; it should not be interpreted as a second metric or a completed material treatment.
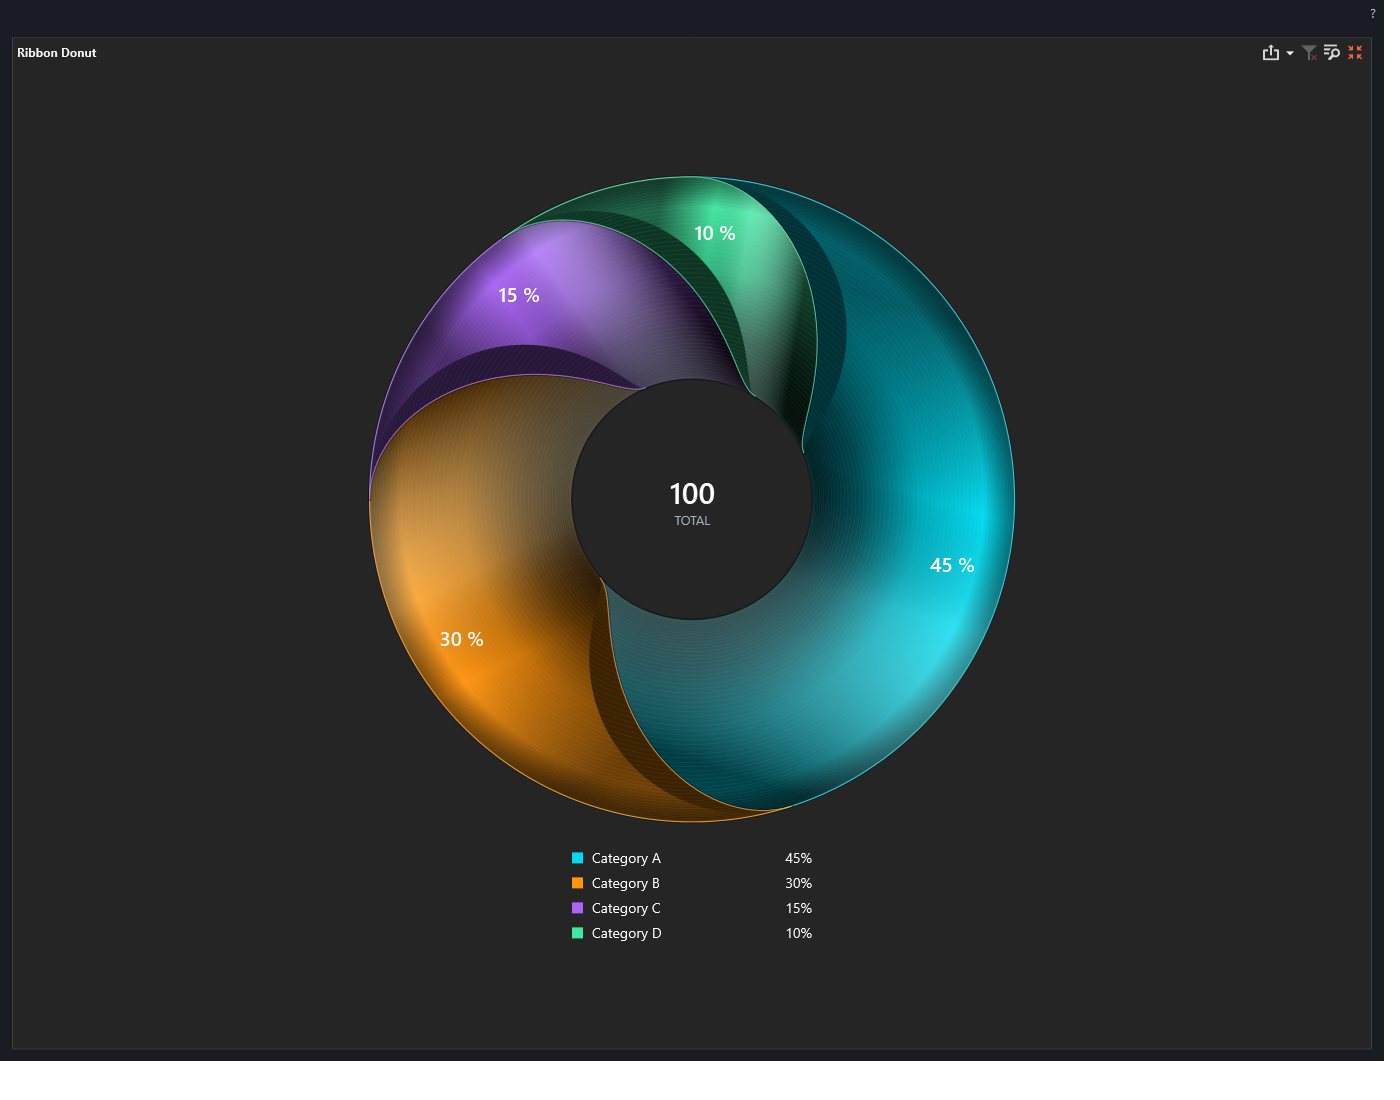
These are prototypes, not pixel-identical reproductions of the reference. Ribbon categories retain their source proportions while their boundaries curve; the decorative shading does not change the values or filters. The treemap's organic reference treatment remains unfinished and is set aside while Ribbon is refined. Ordinary charts remain preferable when a decorative treatment makes comparison harder.
Particle Arc uses a luminous band of points within each native slice. Particle Gradient Treemap uses curved streams of particles within native rectangular cells; it does not yet reproduce the reference's organic region boundaries. Particle positions are deterministic so a refresh, resize or image export does not randomly change the pattern. Particle count, brightness and particle size are decoration, not additional data: compare the labeled values, slice angles or treemap areas instead.
Interacting
- Select a slice or treemap cell to filter Selected categories below the charts. This shows the underlying weight so the visual can be checked against its data.
- Clear the panel's filter to restore all four categories. Selections in multiple panels can combine; clear each active filter when returning to the full reference comparison.
- Use the panel maximize command for a larger view; restore returns to the side-by-side comparison.
- Hover and inspect data use the native Dashboard interaction and source values.
- Resize the sample window to compare dashboard-sized and compact presentation.
Export
Use a chart panel's image or PDF export to retain the current custom artwork. The sample supplies a rendered visual to the native Dashboard export report, because its ordinary pie exporter otherwise rebuilds a standard donut. Excel export remains a data export, not a picture of the decoration. Keep the category labels and values with an exported image so its meaning is not dependent on color alone.
Scope
The experiment is shown in its own Dashboard window. It does not replace existing reports, execute SQL, modify collected data, save a new dashboard layout, or automatically add these prototypes to the production graphics picker. The existing chart styles remain unchanged.
The sample help button opens this online guide first, with local help as the fallback. Related: Chart graphics and native chart types.
Documentation revision: E445C20FC5FC0DB6