
Reports
Help ID: shell.panel.reports
Production reports use native DevExpress Dashboards with linked selection, drill-down, detail inspection, maximization and export. The separate artwork sample remains available, but is no longer the only native report.
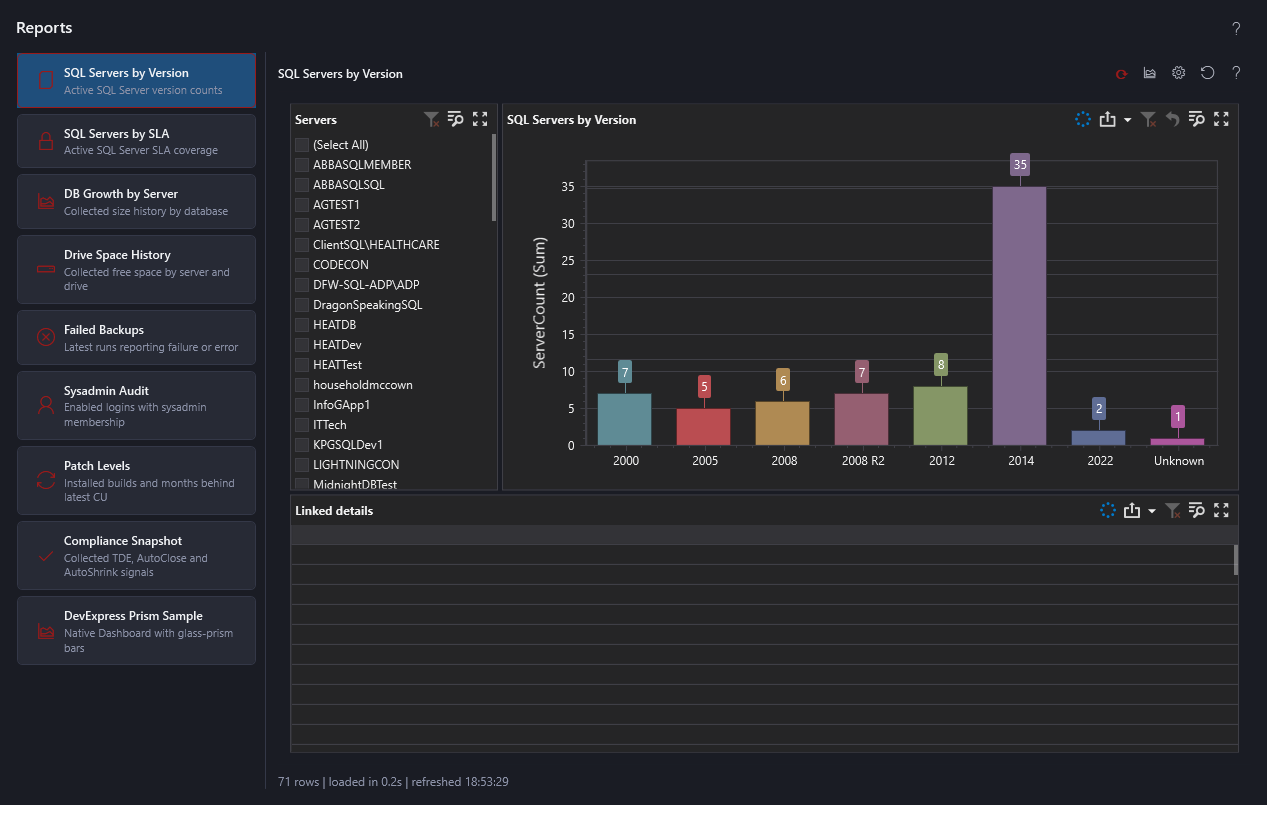
Linked Views
Select a report to load its collected repository data. Selecting a chart category filters the other panels, including the detail table. A server list, when present, filters both chart and table. Multiple selections are supported. Filters combine: an empty intersection means no matching rows, not lost data.
Hierarchical charts expose native drill-down: version/SLA to server, then database/login when provided. Use the chart's drill-down command before selecting a level; drill up to return. Drill-down changes grouping; master filtering restricts other panels. The toolbar reset icon clears selections, range filters and drill positions from the already-loaded snapshot without another SQL query.
Native caption commands maximize panels, inspect data and export. Maximize is useful for many databases or long server names. Exports use the current item/filter scope; inspect linked details before exporting a subset. Custom decorative bars may export as ordinary bars rather than their on-screen artwork.
Reports and Calculations
| Report | Calculation and interaction |
|---|---|
| SQL Servers by Version | One row per active SQL server; sum ServerCount by version and drill to individual servers. |
| SQL Servers by SLA | One row per active SQL server; sum ServerCount by SLA and drill to servers. |
| DB Growth by Server | Last-observed size overview, database selector, collection history, time-range filter and linked observations. Latest bars drill from server to database. |
| Drive Space History | Last-observed free-space overview, drive selector, history, time-range filter and capacity/free-space details. Latest bars drill from server to drive. |
| Failed Backups | Count failure/error runs by server; details retain status and collection time. |
| Sysadmin Audit | Count explicitly enabled sysadmin logins by server; drill to individual login names. |
| Patch Levels | Worst known months behind per version (Max, not sum); drill to servers where the repository procedure provides ServerName. |
| Compliance Snapshot | Sum TDE-disabled, AutoClose and AutoShrink signals by server; drill to databases and inspect each contributing flag. |
| DB Growth Projection | Requested and doubled forecast horizons, adjustable growth reserve, and expandable fleet/server/database/table capacity totals. See projection calculations and coverage. |
These are collected observations, not live probes. Unknown patch age is not zero. Sysadmin Audit does not expand Windows groups or calculate all effective permissions. Failed Backups covers the latest collected log batch, not a freshness/SLA check or complete failure history. Compliance is settings triage, not certification: one database can contribute several signals; unknown TDE is separate and not counted as disabled. System databases are excluded.
History Scope and Performance
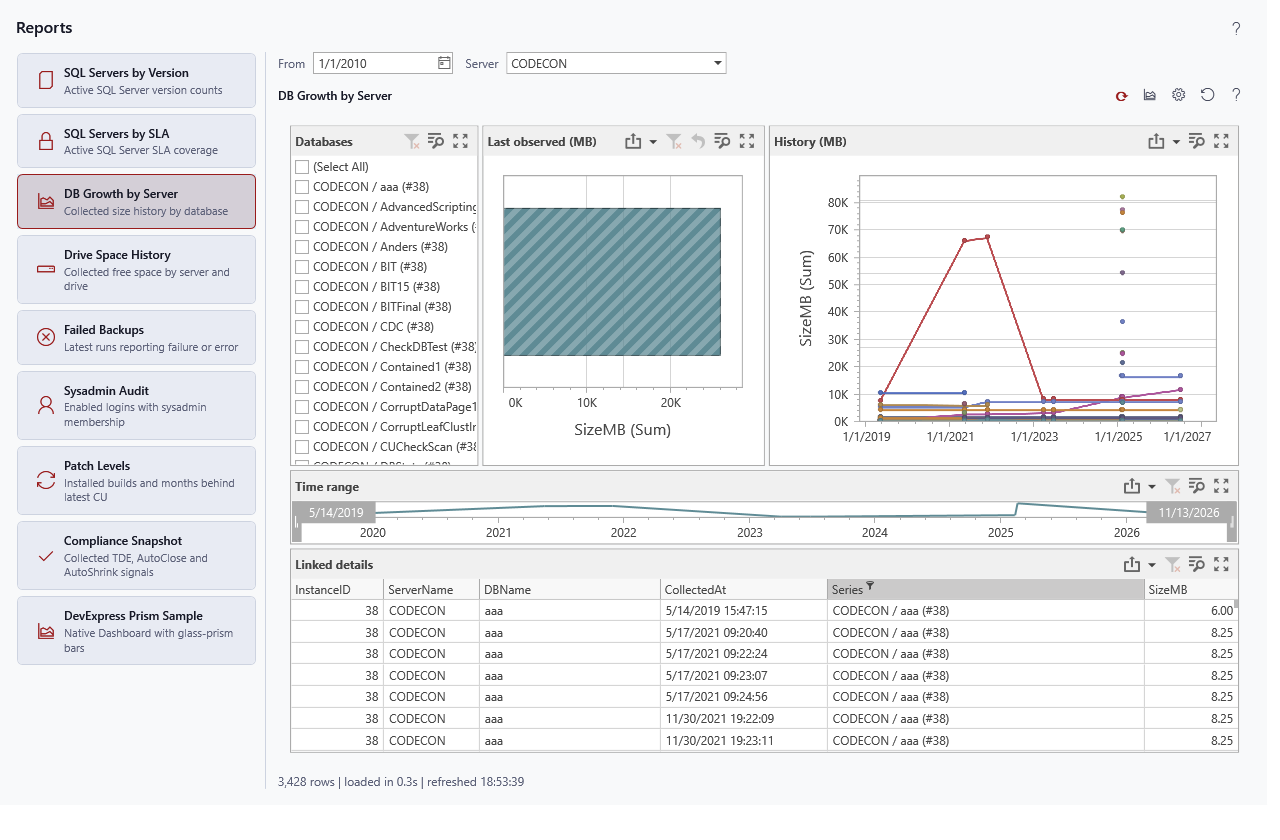
From is inclusive in repository collection time. Server restricts SQL before rows enter the dashboard; it is not a connection to the monitored instance. Initially the first active server is selected. Choose All servers explicitly for cross-server history. Changing Server/From cancels the previous request. The lightweight server list is fetched once per Reports workspace.
Database/drive selection inside the dashboard is local. The last-observed bars use exactly one newest loaded observation per series, never the sum of historical sizes. The server level sums those last observations across its databases/drives. Their timestamps can differ: this is last observed, not a simultaneous server snapshot. Inspect timestamps in the details.
Server totals include only known numeric readings. Unknown sizes remain in the linked details and are not evidence of zero space use; a partial known total is not complete server coverage.
History uses actual collection timestamps, without yearly grouping. A point at 100 MB followed by 120 MB represents 20 MB growth, not a 220 MB database. Size is SizeInKB / 1024; drive free space is bytes / 1073741824. Missing values are not converted to zero. A connecting line does not establish what happened during a collection gap.
Drag the native time-range handles to restrict loaded history/details. This cannot fetch older data; change From for that. The last-observed panel is based on the newest loaded observation; a time range excluding that observation can leave it empty. Reset restores the loaded scope. An uncollected database/drive is absent, not zero-sized.
The range strip uses the largest reading at each timestamp as a navigation overview, not an enterprise/server total. History starts with point labels and legends off unless that report has an explicit saved preference: the database/drive selector already lists the series, and long legends can otherwise consume the plot. Enable them in graphics settings when comparing a small selection.
The migrated report does not execute the old DBSize XML's unrestricted, wide Collector.TableProperties history query. It reads narrow database-size history with server/date predicates. History fetches a 10,001-row look-ahead and retains at most 10,000 rows. A visible warning identifies truncation. This newest-row cap is not a representative sample or guaranteed coverage of every database; narrow Server/From when reached.
Selection, drill-down, time-range and appearance changes reuse one in-memory snapshot rather than requerying for every panel. Refresh fetches a new snapshot and clears selections. Changing reports/leaving the page cancels pending work; superseded completions cannot replace current results. The status shows fetch/preparation time, not the duration of every asynchronous native render step.
No pre-staging tables, collector changes, indexes or repository writes are added. Pre-staging remains a separate decision. Original dashboard definitions informed the linked workflow, but arbitrary legacy XML/SQL is not executed. This is not a port of the old dashboard designer, table-level growth history, OS-inventory reports or general login-role dashboards.
Chart Type Options
The chart-type icon opens a live native preview over loaded rows. Normal bars, lines, areas, points, pies, ranges, bubbles and financial families are available. Selection changes only the preview until Apply.
| Option | Meaning |
|---|---|
| Argument | Category or timestamp on the argument axis. |
| Value | Numeric measure for each category. Normal summaries sum; Patch Levels uses maximum for simple-series measures. |
| Secondary | Optional second numeric measure for simple comparison/stacked charts. Avoid mixing unrelated units. |
| Series | Grouping column producing separate series. History uses database/drive series unless another grouping is mapped. |
| Low / High | Distinct real range columns. Low cannot exceed High. |
| X / Y | Numeric scatter coordinates. |
| Weight | Nonnegative numeric bubble size. |
| Open / Close | Financial values; arguments must be unique and Open/Close within Low/High. |
| Palette | Default is the DevExpress theme palette; Office/Pastel are predefined palettes; Custom uses saved swatches. |
| DevExpress default styling | Keeps ordinary native series models. Clearing it permits decorative artwork on supported vertical and horizontal bars. |
Incompatible types show explicitly labeled Example data, explain the requirement and disable Apply. Those are not collected values; server counts do not become fabricated financial prices. Negative pie values/bubble weights are rejected.
The type configures the primary chart, not auxiliary selectors, latest bars, range strip or details. Changing history to a category/pie chart changes how observations aggregate; keep the default time-series view to read growth over time. Saved fields are revalidated; incompatible mappings fall back to a supported report chart rather than invented values.
Graphics Options
The report toolbar's help icon opens this online guide. The gear opens graphics settings, whose own help icon opens the online graphics guide. The chart-type picker also has its own help icon. Local help is used only if the online topic is unavailable or unmapped. Available styles are visible in the gallery; the controls mean:
| Option | Meaning |
|---|---|
| Palette swatches | Body/series colors, not value changes. |
| Same color | Uses the selected tint across the body palette. |
| Reset palette | Restores the vivid custom palette, not the theme Default palette. |
| Ring color / Match palette | Separate ring tint or a link to each bar's body color; only affects ring artwork. |
| Glow / Ring glow | Decorative intensity; independent ring glow can link back to body glow. Neither scales data. |
| Value labels | Numbers at chart points; often best disabled for dense history. |
| Legend | Color keys; many series can consume substantial room. |
| Label direction | Horizontal, diagonal or vertical category labels. |
| Bar width | Bar thickness/spacing, never a value multiplier. |
| Grid lines | Numeric-axis reference lines. |
| Axis titles | Shows/hides available numeric-axis titles. |
| Default for new charts | Saves a default without replacing existing per-chart choices or copying another chart's field mappings. |
Apply saves per-report choices in existing user configuration. Cancel discards the draft. A type picker opened inside graphics edits that draft; the parent's Apply commits it. Appearance/reset rebuilds the in-memory dashboard and clears transient filters without SQL. Result rows/filter selections are not saved to disk.
Troubleshooting
Colored errors identify repository connectivity, permission or schema failures. Correct the cause and refresh. Empty history can mean the repository has no collections since From. Reset filters before assuming data is missing. Right-click the shared refresh control for automatic refresh options.
Support includes report name, scope, dates, loading state, row count and lifecycle metadata, not rows, login lists, credentials or SQL. --harness-reports checks live read-only queries, cancellation/races, native rendering, exact linked filtering/reset and latest observations. Results: %TEMP%/MinionReports.txt. --harness-chart-types verifies native families and graphics persistence. No report runs maintenance or jobs.
Related: Graphics and picker details, Repository configuration, DevExpress chart series.
Documentation revision: A5BB03232124600A