
Database Growth Projection
Choose Reports > DB Growth Projection to estimate future table data and index space from collected history. The report provides both the requested forecast period and twice that period: 6 months produces 6- and 12-month plans; 12 months produces 12- and 24-month plans.
What This Report Is For
Use this report to answer how much table data and index space will we need if the observed growth continues? It is a planning tool, not just a size inventory. The first horizon supports the immediate planning period; the doubled horizon exposes the longer-term consequence of waiting. For example, choose 6 months when arranging the next storage expansion and use the 12-month result to assess whether that expansion will last.
Start at the fleet grand total to understand overall demand. Compare server subtotals to find where that demand lands. Expand the busiest server into databases, then schemas and tables, to identify what is driving it. A fleet-wide surplus does not solve a shortage on a particular server or volume. Table forecasts are the starting point for a storage plan, not a substitute for file and drive capacity checks.
The report modernizes the legacy growth projection while retaining its central idea: one chosen horizon, a second horizon twice as long, and a breakdown that explains every total.
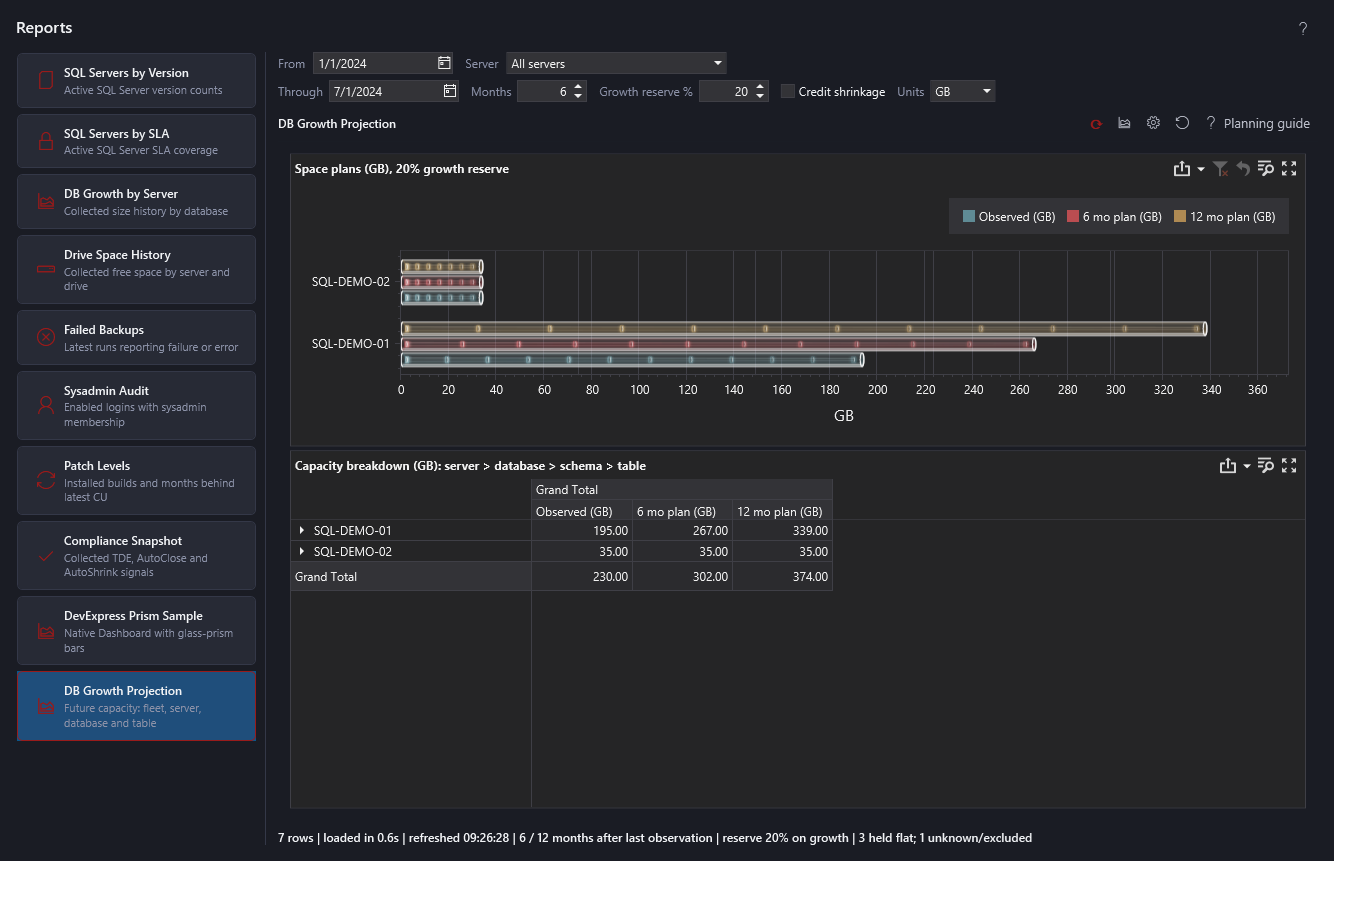
Inputs
| Control | Meaning |
|---|---|
| From / Through | Inclusive calendar dates bounding the historical sample, in repository collection time. Through includes the whole day. |
| Server | All active SQL servers initially, or one repository instance. It limits the SQL read before calculation. |
| Months | First horizon, 1-120 months. The second is automatically doubled. Horizons begin at each table's last observed collection, not today's date. |
| Growth reserve % | Cushion applied to positive forecast growth only, not existing space. Default 20%, matching the purpose of the old spreadsheet. |
| Credit shrinkage | Off by default. Negative historical growth is not used to reduce a capacity plan. Enable it for signed linear estimates; projected sizes are still floored at zero. |
| Units: TB / GB / MB / KB | One conversion for chart and breakdown. Every size heading includes the selected unit, including in exports. GB is the starting unit; use TB for large estates or MB/KB for small tables. Conversions use 1,024 between adjacent units. |
Changing the sample window or server fetches new collection endpoints. Changing only months, reserve or units recalculates the already-loaded endpoints without another SQL read. Explicit Refresh deliberately invalidates that cache. Result rows and cached endpoints remain in page memory and are not saved to disk.
Read the Dashboard
The space-plans chart compares last-observed size with the two capacity plans. Use the Server picker above the report to load one server or the whole fleet. Select chart points to filter the breakdown, or use native drill-down to move through server, database, schema and table. Drill up to return. The primary chart uses the two fixed planning horizons for normal comparison series; specialized chart types may display the mapped primary value instead. Maximize the chart for more room when many servers are loaded.
The capacity breakdown is a native expandable pivot. It starts collapsed at server level. Expand a server, database and schema to see individual tables. Server/database subtotals and the grand total are sums of exactly those table rows, not a separate estimate calculated from unrelated database allocation counters. Native maximize and export commands are available on each panel. Selection changes the scope of totals and exports; reset restores the full loaded scope.
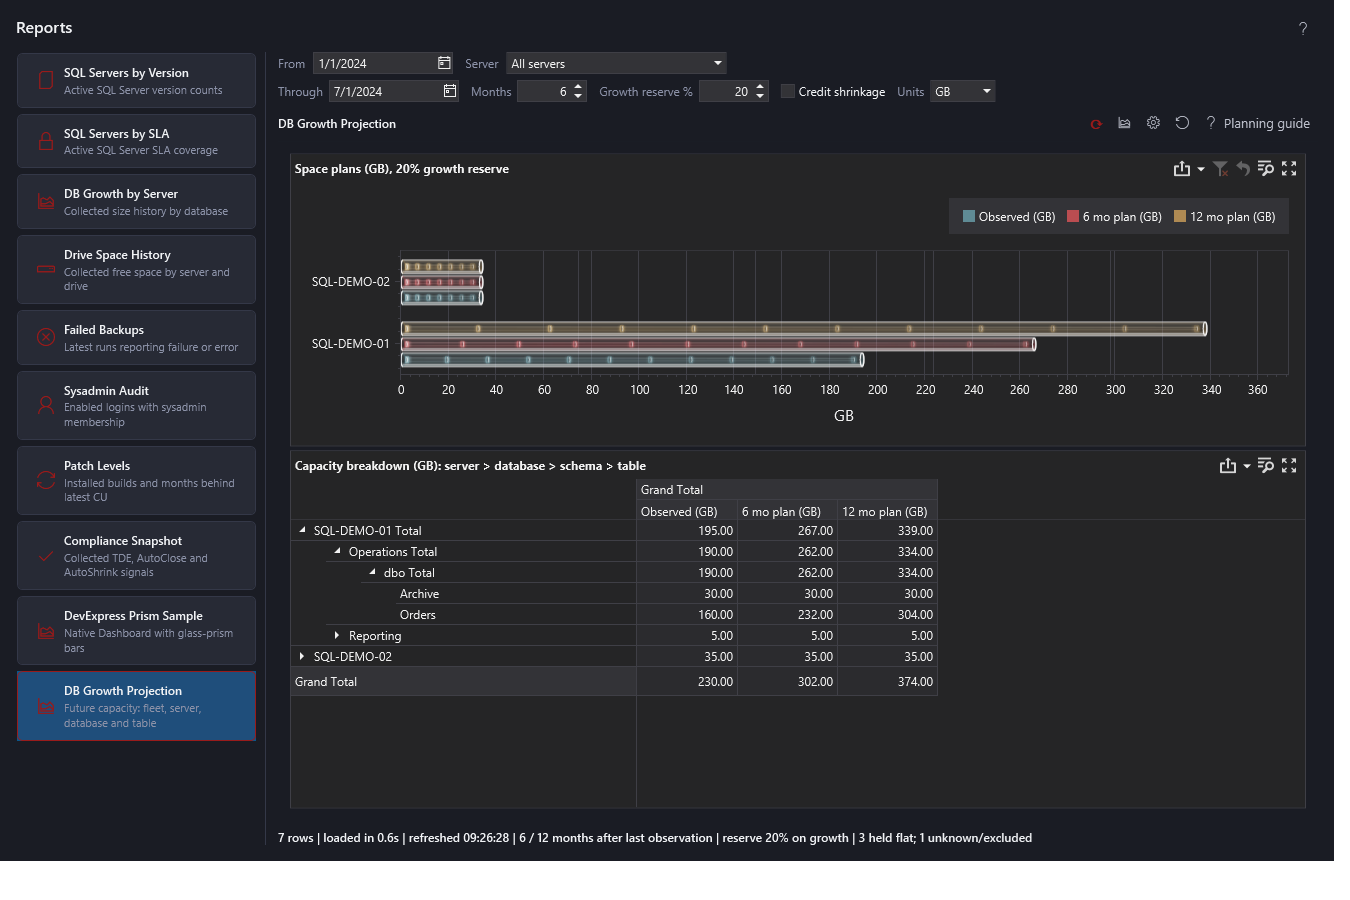
Use Inspect data on a chart point or the breakdown to see its contributing rows. Chart inspection includes baseline, data/index split, signed monthly rate, rate used for planning, forecast growth, reserve, forecast dates and estimates before reserve. The normal pivot stays at three size columns so it does not reproduce every KB/MB/GB column from the old spreadsheet. Coverage counts remain in the footer rather than occupying a separate totals panel. These counts matter: a neat total is not a complete estimate when its history is missing.
Planning guide beside the chart controls opens this online article. The page help icon uses the same contextual guide while this report is selected. Local help is the fallback if online help cannot be reached.
A Practical Planning Session
- Choose representative history. Set From and Through to bracket ordinary operation, including relevant business cycles. Do not use a quiet holiday week to represent a year of normal activity, or a one-time import as though it repeats indefinitely. The calculation uses the first and last database collections inside this window; intermediate spikes are not fitted to a trend.
- Check freshness and coverage first. Read the held-flat and unknown counts. Inspect dates on the servers/databases that drive the plan. An old collection does not become current just because Through is today. Resolve missing collection coverage before treating a fleet total as complete.
- Choose the decision horizon. Months is future planning time, not the historical sample length. A 12-month history can support a 6/12-month forecast; the two settings are independent. Each forecast begins at its own last-observed date.
- Set the reserve deliberately. Start with an allowance appropriate to uncertainty and lead time, then compare a second scenario. The reserve increases positive future growth only. It does not add a percentage of all existing data and is not a statistical confidence level.
- Keep shrinkage credit off for conservative capacity planning. Enable it only when the observed reduction is expected to continue and can actually release usable capacity. Shrinking table contents does not automatically return allocated file space to a drive.
- Find the drivers. Expand the largest server subtotal through database and schema to table. A small current table with a high growth rate may matter more to the next expansion than a large stable archive. Compare both horizons rather than ranking only today's sizes.
- Challenge the estimate. Re-run using a shorter and a longer representative window. A large difference is a reason to investigate a workload change, retention cleanup, migration or unusual collection endpoints, not to average the outputs blindly. Changing Months, reserve or units reuses the loaded endpoints; changing dates or Server reads a new scope.
- Export the intended scope. Clear chart selections and choose All servers before exporting a fleet plan. Export the capacity breakdown for the hierarchy and subtotals; export the chart for the visual comparison. Unit-bearing column names keep the size values meaningful outside the app. Record sample dates, horizon, reserve, shrinkage setting and coverage alongside the exported report.
Read the Three Columns Together
| Pattern | Meaning and next step |
|---|---|
| Last observed is large, both plans are close to it | Large footprint, little inferred growth. Inspect the observation span and coverage before concluding it is stable. |
| Both plans are larger, and the doubled horizon adds roughly another equal increment | The linear model is extending positive historical growth. Check the tables responsible and whether that growth is expected to continue. |
| A table is flat but marked held | There was not enough comparable history. This is not evidence of zero growth. Find its missing/changed observation before relying on the forecast. |
| Plans fall with Credit shrinkage enabled | Historical net reduction is being extended. Confirm the reduction is repeatable; it is not a guarantee of physical disk reclamation. |
| A cell is blank and coverage is unknown | No numeric estimate is available. Blank is not zero. The displayed numeric grand total excludes that unknown amount. |
Additional capacity is plan minus last observed. For example, a server with 160 GB last observed and a 232 GB first-horizon plan needs 72 GB more table/index space under that scenario. Do not request 232 GB additional storage on top of the existing 160 GB. Also do not assume an existing 72 GB of free file space is on the correct server, database or volume: validate placement and usable headroom separately.
With shrinkage credit disabled, the second horizon doubles forecast growth and its reserve, not the entire final footprint. A 232 GB six-month plan therefore does not imply a 464 GB twelve-month plan.
Chart Appearance and Exports
Use Chart graphics to choose ordinary DevExpress styling or custom power rings, glass prism, glass cylinder, cylinder with rings, or rings inside a prism. Horizontal and vertical bar charts both support the custom artwork. Glass/palette color and ring color can be separate; glow changes appearance, never the capacity values. Applying a different style updates the report, not just the picker preview.
Use Chart type to choose among compatible native chart types with live previews. Keep grouped bars when comparing last observed and both horizons directly. Stacked bars add the series visually, so they are not three independent required-capacity totals; a pie or other specialized mapping may show only one chosen measure. Attractive artwork must not change how you interpret the numbers. The normal DevExpress styles and palettes remain available.
Exported size headers include units individually, for example Observed (GB), 6 mo plan (GB) and 12 mo plan (GB). Observed means the last measured data/index size, not a forecast. Changing Units to MB changes both values and headings. The chart caption also records reserve percentage. Size exports are forecasts, not measured future sizes; keep the calculation settings and coverage with any planning handoff.
Calculation
The source is Collector.TableProperties, specifically DataSpaceUsedInKB plus IndexSpaceUsedInKB. For each database, the service finds the first and last collections inside the selected window and reads only table rows at those endpoints. Duplicate table records at the same timestamp use the newest collector ID. It compares matching schema/table identities and checks object IDs and creation dates when available.
For a table with usable endpoints:
- Baseline and last-observed sizes are data plus indexes.
- Elapsed months = elapsed days / (365.25 / 12).
- Observed monthly growth = (last size - baseline size) / elapsed months.
- Planning rate = the observed rate, except negative rates become zero unless Credit shrinkage is enabled.
- Forecast growth = planning rate x horizon, bounded so final size cannot be negative.
- Reserve = positive forecast growth x reserve percentage.
- Required capacity = last-observed size + forecast growth + reserve.
- Additional space = required capacity - last-observed size.
For example, a table grows from 100 GB to 160 GB over exactly six elapsed months. Its rate is 10 GB/month. Six months adds 60 GB plus a 12 GB reserve, giving 232 GB required and 72 GB additional. Twelve months adds 120 GB plus a 24 GB reserve, giving 304 GB required and 144 GB additional.
This deliberately improves on the legacy Collector.spDBGrowthProjection without changing that procedure. It uses elapsed time rather than counting crossed calendar-month boundaries, does not manufacture a 1 KB rate for flat tables, and never uses a forced one-month denominator to hide insufficient history. Per-table conservative estimates can exceed the old database-net estimate when growth in one table is offset by shrinkage in another. That is intentional with shrinkage credit disabled.
Coverage Is Part of the Result
| Condition | Treatment |
|---|---|
| Less than one day between observations | Hold the last-observed size flat; no inferred monthly rate. |
| Table missing from the first database collection | Hold its last-observed size flat; a missing baseline is not assumed zero. |
| Table missing from the last database collection | Retain the first/last-known size and flag it. Absence is not proof of deletion or released capacity. |
| Object ID/creation date changed | Hold flat rather than treating replacement objects as one growth history. |
| Missing or negative space counters | Exclude the numeric estimate and report unknown coverage, not a zero-sized table. |
| Server has no table collections in the window | Retain a clearly named no-history entry with no forecast; do not silently omit the server. |
Held-flat estimates are placeholders, not evidence that growth will stop. The footer highlights coverage warnings. Different databases can have different endpoint dates; the fleet total is a planning rollup of those last observations, not a simultaneous fleet snapshot. Inspect the forecast dates before interpreting them as a single calendar-date commitment.
The endpoint calculation does not model changes between the two selected observations. A temporary spike, shrink followed by regrowth, seasonal load or a future deployment can invalidate the linear assumption. Choose a representative sample, compare more than one window and inspect the contributing tables. The reserve is a user-selected planning allowance, not a statistical confidence interval.
Boundaries and Performance
These are table data/index estimates, not transaction-log, backup, free-file, autogrowth or physical-drive capacity forecasts. Do not add database allocated size to the same table totals; that would double-count space. File allocation, retention, compression, dropped objects, FILESTREAM and other storage may need separate planning.
The report reads bounded endpoint rows, not the entire table-history payload into the GUI. It uses existing repository indexes and makes no schema, collector, stored-procedure or pre-staging changes. More than 100,000 table/scope rows is rejected with a narrowing message; partial totals are never presented as complete. The result may still contain unknown coverage even below that limit.
Validation: --harness-growth-projection checks horizon doubling, reserve arithmetic, shrinkage, units, missing history/identity, total reconciliation, native filtering/drill-down and read-only live schema. It writes %TEMP%/MinionGrowthProjection.txt and preview images under %TEMP%/MinionGrowthProjection. Support records scope, dates, planning inputs, row count and elapsed time only, never report rows or SQL text.
Related: Reports and chart options, Files and I/O.
Documentation revision: DD7772419C9377DA