
Database Files & I/O
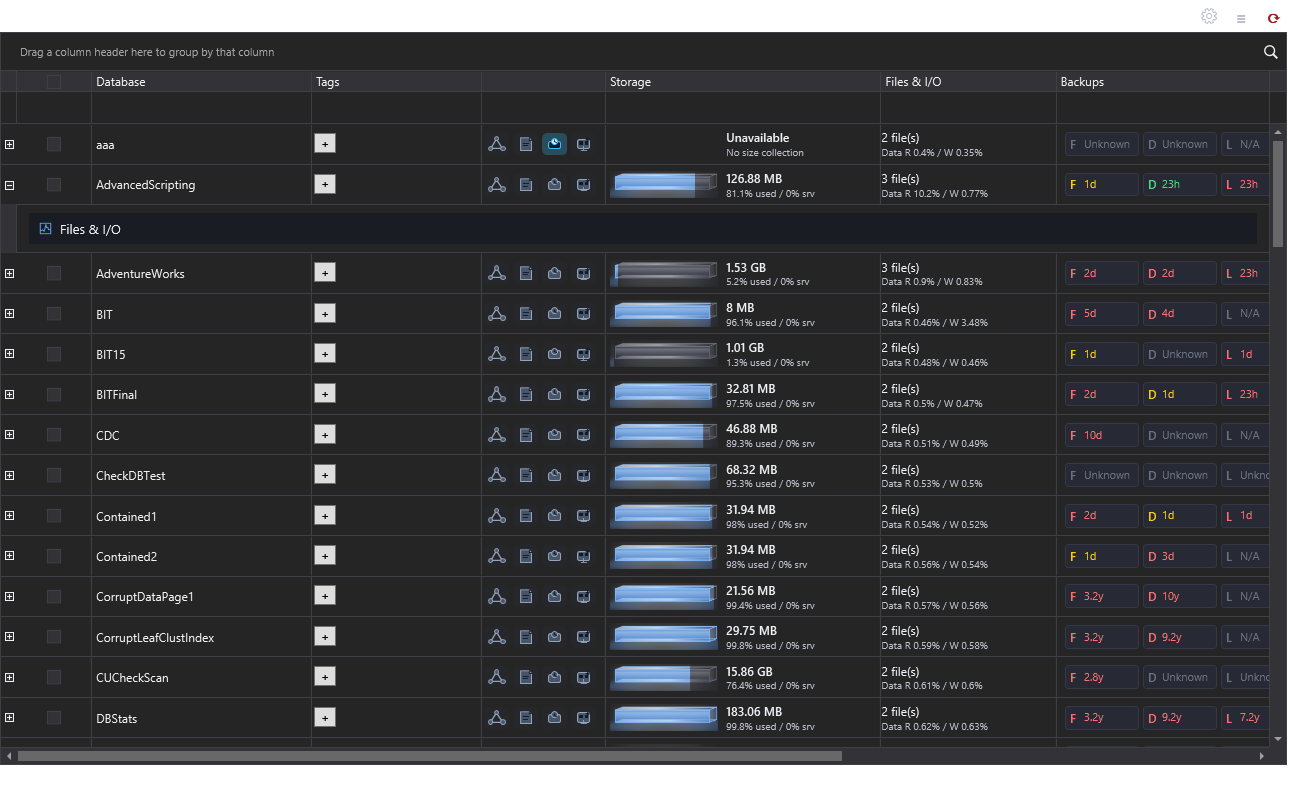
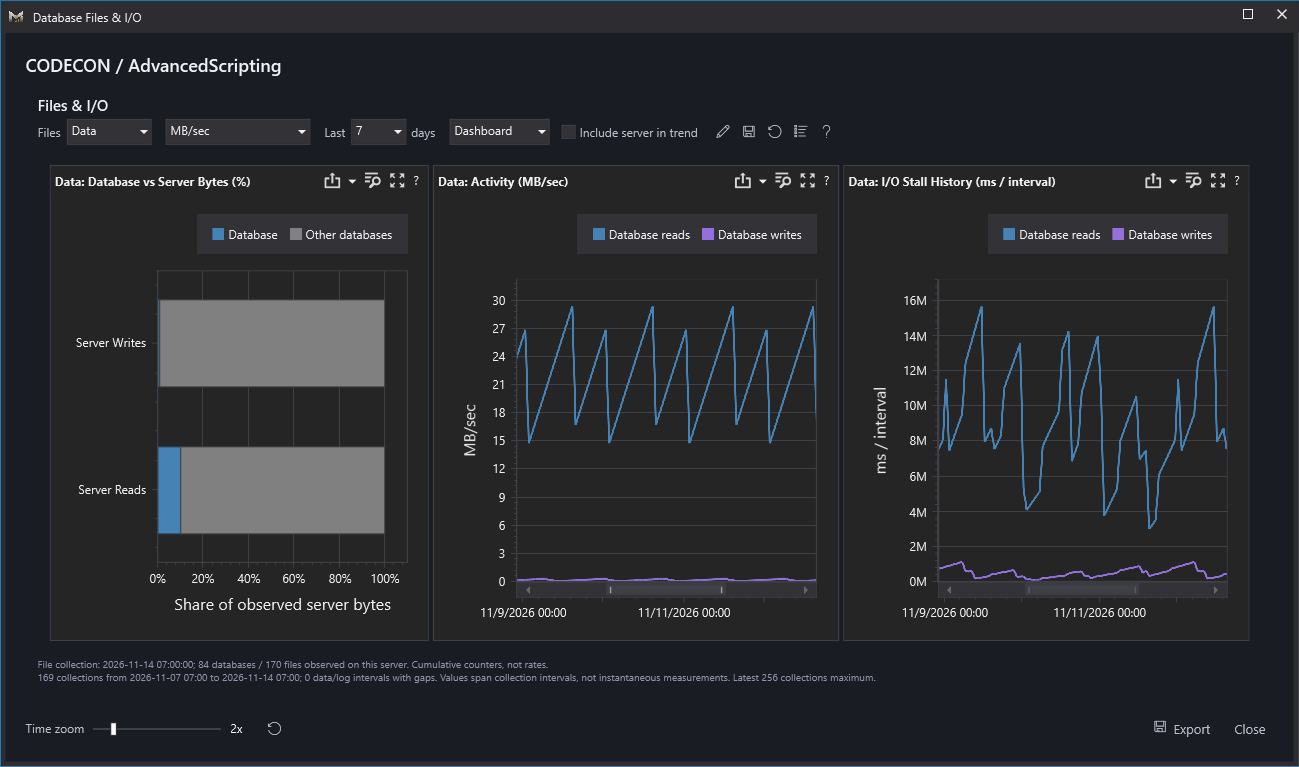
Expand a database row in Server Detail or Enterprise Search, then click Files & I/O in its compact Analysis strip. The existing full-sized window opens directly; expanding a row no longer constructs charts or loads history. The default Dashboard contains comparison, activity and stall history. Inspect opens file properties and interval tables separately. Classic retains its charts, summaries and file grid. All use retained Collector.DBFileProperties, not a live target-server connection.
Dashboard Panels
Reading These Charts
The visible ? button opens this guide. Each chart also has its own ? caption button, including when maximized. Help opens above the expanded window rather than in the main application behind it. The inline teaching expander is removed.
- Server share: historical volume is not current load
- Activity: more work versus slower operations
- Stalls: identical total wait, very different latency
The comparison uses cumulative bytes, not current activity. A database responsible for most historical reads is not necessarily slow now. Use interval activity and average stall to investigate current workload changes. The stall-history panel reports total wait milliseconds per interval, not milliseconds per operation: a longer interval or more operations can produce a larger total without worse per-I/O latency.
For example, rising total stall alongside proportionally rising I/O can reflect more work; rising average stall under a comparable workload deserves closer investigation. Compare against the normal workload and inspect interval length, missing samples and collection age. Data and log files have different workloads; no universal threshold is implied by these graphs.
The expanded window's Time zoom narrows both timelines together. Reset restores the full range. PNG shows the active zoom; CSV retains the loaded interval rows.
Definitions: Microsoft file I/O counters.
Panel Contents
- Database vs Server Bytes: cumulative server Reads/Writes stacks, split into this database and the remaining observed databases. They are not interval throughput. Inspect underlying data for exact database/other/server bytes and database percentage.
- Activity: the selected interval metric, with database read/write lines and optional server lines.
- I/O Stall History: read/write stall milliseconds per collection interval, shown independently of the selected activity metric. Optional server lines also apply here.
- Inspect / File Inventory: opens the retained file snapshot separately, including sizes, shares, latencies and extended properties.
- Inspect / Collection Interval Details: exact boundaries, duration, status, differences and selected metrics. The inspection dashboard retains linked interval filtering. These tables no longer consume space in the primary graph view.
Use expand for the complete chart window. Item captions provide maximize, export, inspection and metric help. The pencil arranges the three charts; Save remembers viewer resizing and Reset restores defaults. Existing saved layouts omit the retired table slots. Positions remain under DatabaseIoDashboardLayout; no source rows or connections are saved.
Data/Log and the range/metric controls apply to the charts and interval details. File Inventory retains every collected file type, including FILESTREAM/other files. Filtering file rows never recalculates the database/server denominators or invents per-file history from database totals. Missing/reset intervals remain missing rather than zero-filled. The full-panel PNG captures the active dashboard; native item exports respect item filters. Window CSV exports the selected Data/Log interval history, not transient dashboard filters.
File Properties
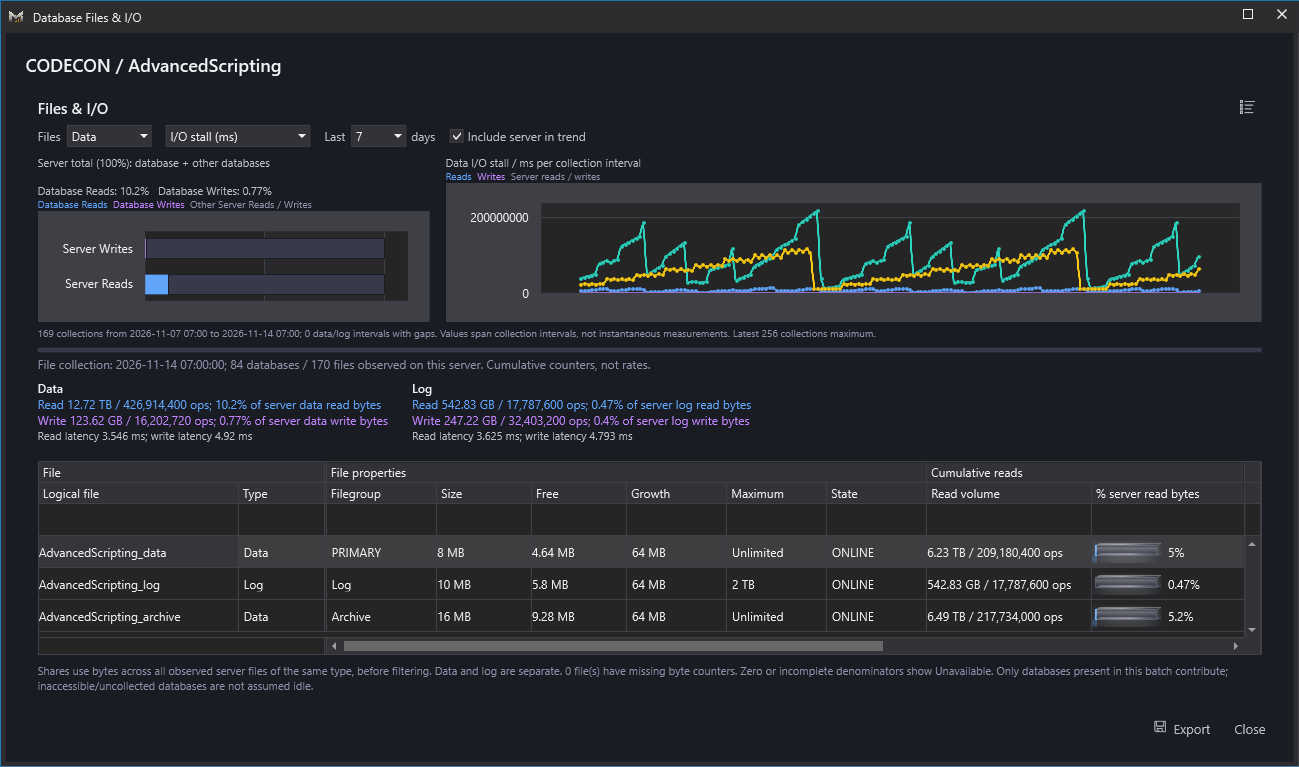
File properties include logical name, type, filegroup, size, free allocation, automatic growth, maximum size, and state. Classic's file column chooser exposes physical path, file ID, used allocation, read-only/sparse state, on-disk allocation, volume free space, operation counts and total stalls. Dashboard keeps these fields in its underlying snapshot data. Sorting on size/bytes/shares uses the underlying numeric value, not the formatted label. Growth and maximum are descriptive strings.
The collector already normalizes size, fixed growth and maximum size to KB; the historically named max_sizeByte is also KB in this collector. The UI does not multiply growth by 8 a second time. Percentage growth remains a percentage. Maximum -1 displays Unlimited and 0 displays No growth. Volume free space is a volume observation, not space reserved for this file; do not sum it across files on the same volume.
Performance
Classic's two I/O bands display cumulative physical read/write bytes and operation counts, each file's share of server bytes, and weighted average latency. Hover on read/write volume for exact bytes/count/stall values. Its read and write share bars use the existing dashboard glass renderer with blue/purple colors; these colors distinguish directions, not health thresholds.
- Read share = this file/database's read bytes / all observed server read bytes of the same file type x 100.
- Write share = this file/database's write bytes / all observed server write bytes of the same file type x 100.
- Read latency = total read-stall milliseconds / total read operations. Write latency uses the corresponding write counters. Database latency is weighted by operations, not an average of file averages.
For example, if all collected data files read 100 GB and one database's three data files read 5, 3 and 2 GB, that database accounts for 10% of server data reads. The three file shares are 5%, 3% and 2%. Filtering Search to that one database does not turn it into 100%.
Log files have their own totals and denominators. A log file with 10% of server log writes is not claiming 10% of data writes or of combined server I/O. FILESTREAM/other file types retain their properties and same-type file shares but are not mixed into the Data or Log summary.
The file table remains cumulative in both presentations. Classic's charts add two 100% stacked bars for Server Reads and Server Writes, plus a read/write history line. Each stack splits the server total into this database and the other databases; it never adds the database on top of the whole server. In Classic, database percentages appear above the bars, and segment tooltips show percentage, formatted volume and exact bytes, plus database and server totals. Missing or zero server denominators remain unavailable in either presentation.
In Classic, click either chart (or the expand icon) to open the entire Files & I/O panel: charts, collection context, Data/Log summaries, file properties, I/O grid and column chooser. Drag its divider between charts and file details to give either region more space. In Dashboard, use the expand icon and native dashboard layout controls. File grids remain bounded; parent-grid scrolling is unchanged.
Choose Data or Log, a 1/7/30-day range, and a history metric:
- MB/sec = byte-counter difference / elapsed collection seconds / 1,048,576.
- IOPS = operation-counter difference / elapsed collection seconds.
- I/O stall (ms) = read/write stall-counter difference for each collection interval, summed across the selected database's files. These are interval totals, not lifetime counters or stall per operation. Optional server lines sum all observed files of the same type. For example, a read-stall counter increasing from 10,000 to 14,000 ms plots 4,000 ms at the interval end. Longer intervals can accumulate more stall; compare average stall per operation when assessing latency independently of interval length or activity. Concurrent file waits can sum beyond elapsed wall-clock time.
- Avg stall (ms/op) = stall-counter difference / operation-counter difference.
- Server share (%) = database interval bytes / observed server interval bytes of the same type x 100.
Read/write rates and per-operation latency describe interval averages, while I/O stall (ms) describes interval totals; none are instantaneous activity or logical query reads. Include server in trend adds server-wide read/write lines for MB/sec, IOPS, total stall and average stall; it is disabled for the share metric, which already uses the server denominator. Server comparison stacks include the selected database as one segment and all other databases as the remainder. The cumulative comparison and interval trend deliberately have different time semantics.
History uses consecutive whole-server batches, matching file IDs and file GUIDs (or physical-path identity if GUID is unavailable). Changed/missing file sets, decreasing counters, decreasing/missing sample clocks, and replaced files generate gaps instead of false spikes or zero-filled measurements. Stall values can be unavailable even when byte rates are known. Undetectable resets that recover above all previous counter values cannot be reconstructed from these counters alone. At least two compatible retained collections are needed.
The service loads at most 256 collections in the requested range, plus an earlier baseline if it fits within that cap. Actual first/last collection times and gap counts are shown. Dense 30-day histories may therefore display fewer days; no samples are downsampled into invented measurements. Historical server cutoffs apply to every history query. Reopening a still-current loaded band reuses its in-memory history; refresh replaces its row context. Changing the range cancels the old request, and late responses cannot overwrite the newer choice.
Chart Export
The expanded window's Export button offers PNG and CSV. PNG captures the complete visible panel, including charts, title, selections, collection context and visible file-grid rows at high resolution. Scroll the file grid or resize its region before exporting to choose which rows are visible. CSV exports the selected Data/Log intervals with both database and server MB/sec/IOPS and total read/write stall milliseconds, database stall-per-operation and server byte shares, elapsed seconds, collection timestamps and gap status. Unknown values are empty, not zero. Numbers use invariant formatting, timestamps retain collection-clock semantics, and spreadsheet-sensitive names are escaped. Exports are written only after choosing a destination.
Scope, Missing Data & History
The service resolves one whole latest file batch per server at or before the selected cutoff. It never takes the newest row separately for each database, mixes servers, or substitutes a future/current collection into history. The file-collection time is shown separately from database properties because their schedules differ.
Percentages are calculated before UI filtering, including collected files belonging to databases not currently visible in the database results. Data/log denominators remain independent. The coverage line reports how many database/file rows were observed. Databases that failed collection or are absent from that batch cannot contribute; the UI does not assume they were idle. The percentage is therefore explicitly of observed server activity.
Unknown/negative counters are not zero-filled. If any file in a type is missing byte counters, the corresponding server share is Unavailable. Zero-byte denominators are also Unavailable. Zero-operation latency shows No operations. Missing file collections show a clear empty-state message without removing the database row; loading failures are isolated to the file band and can be retried using the shared parent refresh.
Development Data
This repository is a sample database; the GUI does not mark its rows as sample data. Database/Development/SeedCodeconFileIoPreview.sql initializes CODECON file inventory when none exists. SeedCodeconFileIoHistory.sql adds a week of hourly, varying workloads for 84 databases and 170 files, retaining stable file identity. Both scripts are restricted to CODECON.Minion instance 38 and never alter physical SQL Server files/settings or make backups of sample data.
Support
Loading uses bounded server fan-out and cancellation, with parameterized instance/cutoff/range values. History loads lazily when expanding a band, not once for every visible database. Support events include instance ID, interval/collection counts, range, export format and handled failures; file paths, file handles, database names, row payloads and export destinations are not added to custom support events. The existing user configuration/state collectors need no new persisted file. Details reuse DevExpress master-detail virtualization, not an independent refresh timer or capturing hover window.
Sources: Physical file I/O counters, File catalog properties, DevExpress master-detail content.
Documentation revision: 283C7378FA6DB430