
Reading Database and Server I/O Share
This comparison answers which observed database accounts for these cumulative read/write bytes? It does not show current throughput, disk fullness or device utilization.
Worked example: large historical share, quiet now
Suppose observed data-file reads total 1,000 GB. This database has 400 GB, and all other observed databases together have 600 GB. The stack is 40% database + 60% others = 100%. Hover each segment for both its percentage and actual bytes. Writes have their own denominator: a database can account for 40% of reads but only 5% of writes.
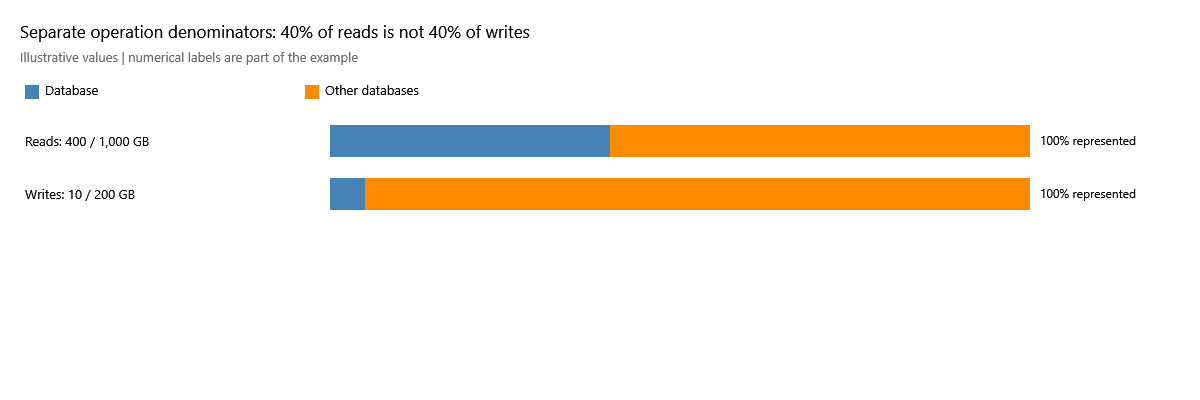
Reads use 400 / 1,000 GB = 40%; writes use 10 / 200 GB = 5%. The blue segments are not directly comparable as byte volumes unless you also read the actual numbers. A full stack is an accounting total, not a storage-utilization gauge, and its total is not database bytes plus server bytes: that would count the database twice.
The database might have done most of its reading during last night's batch and be quiet now. Open the activity history for recent intervals before calling it the current heavy hitter. The current comparison and interval history describe different time scopes; neither is wrong merely because they differ.
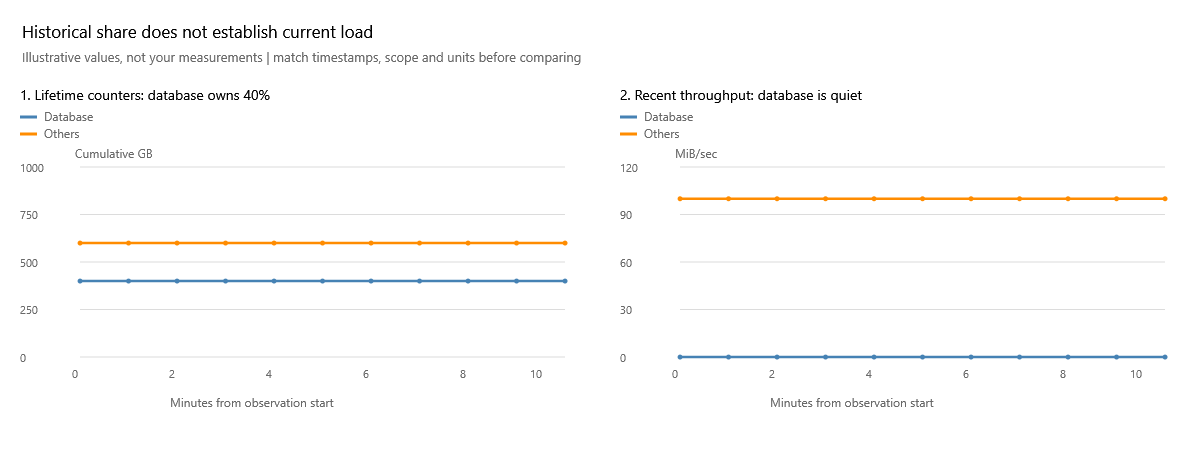
The left plot is historical byte ownership; the right is recent interval throughput. Here the database retains 40% of historical bytes but transfers none in the recent window, while peers transfer 100 MiB/sec. This is why the next graph is Activity, not a severity judgment based on share. Keep the selected file type and database consistent; the units and time scopes deliberately differ between these two plots.
Worked example: the denominator changes the story
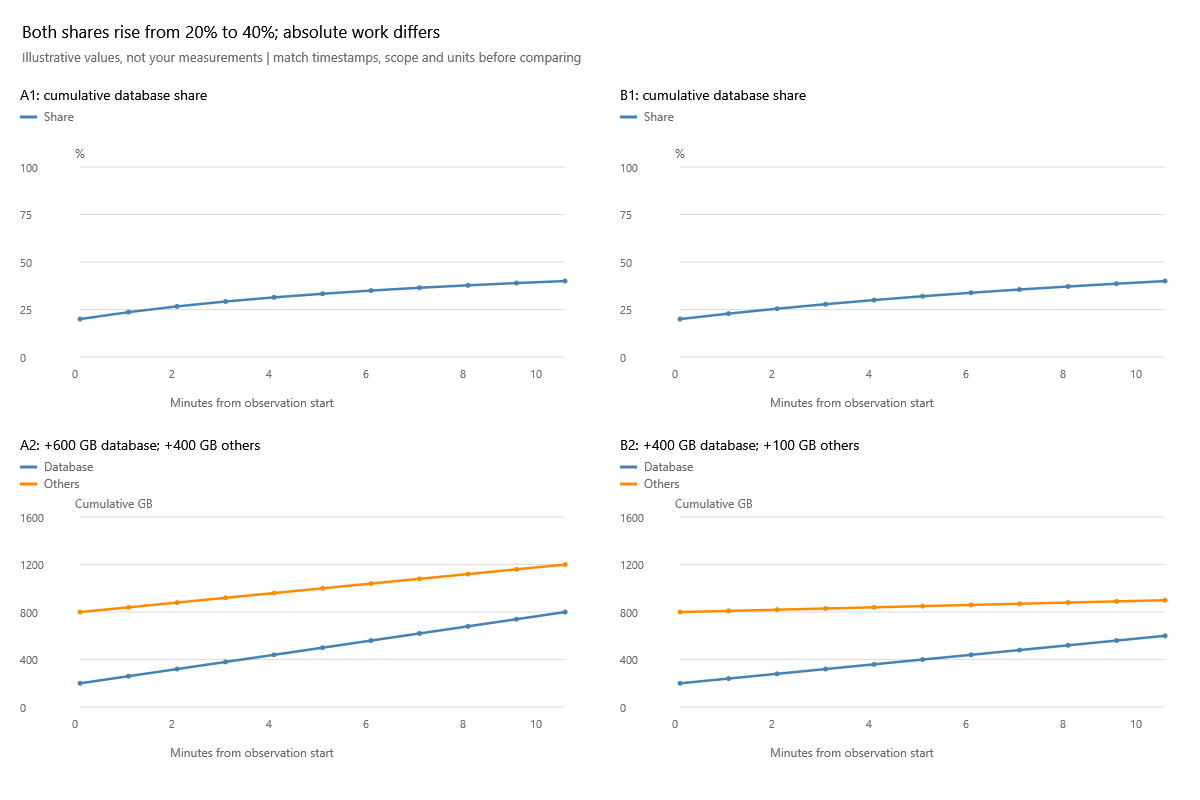
Both cases begin with 200 GB database + 800 GB others. A ends at 800 + 1,200 GB: 40%, after 600 GB of database work and 400 GB from peers. B ends at 600 + 900 GB: also 40%, after 400 GB of database work and 100 GB from peers. The final share is identical, but the amount of additional work differs. Read down each column to connect the percentage to its byte counters.
These are cumulative counters, so bytes do not normally decrease within a continuous counter lifetime. Peers doing less new work does not erase their old bytes. A falling cumulative total suggests a reset, changed collection coverage or another discontinuity to investigate, not negative I/O. Use interval activity to ask which workload is busy now, rather than treating the cumulative share as an instantaneous rate.
Data and log selections compare their own file types. Missing/unavailable inventory is not zero. Check collection coverage and age, especially after restarts/counter resets. A cumulative share spans the available counter lifetimes; it is not a guaranteed common-start workload comparison.
Next step: identify a database here, then examine interval throughput and stall/latency together. High share alone is not a performance fault or proof that storage is saturated.
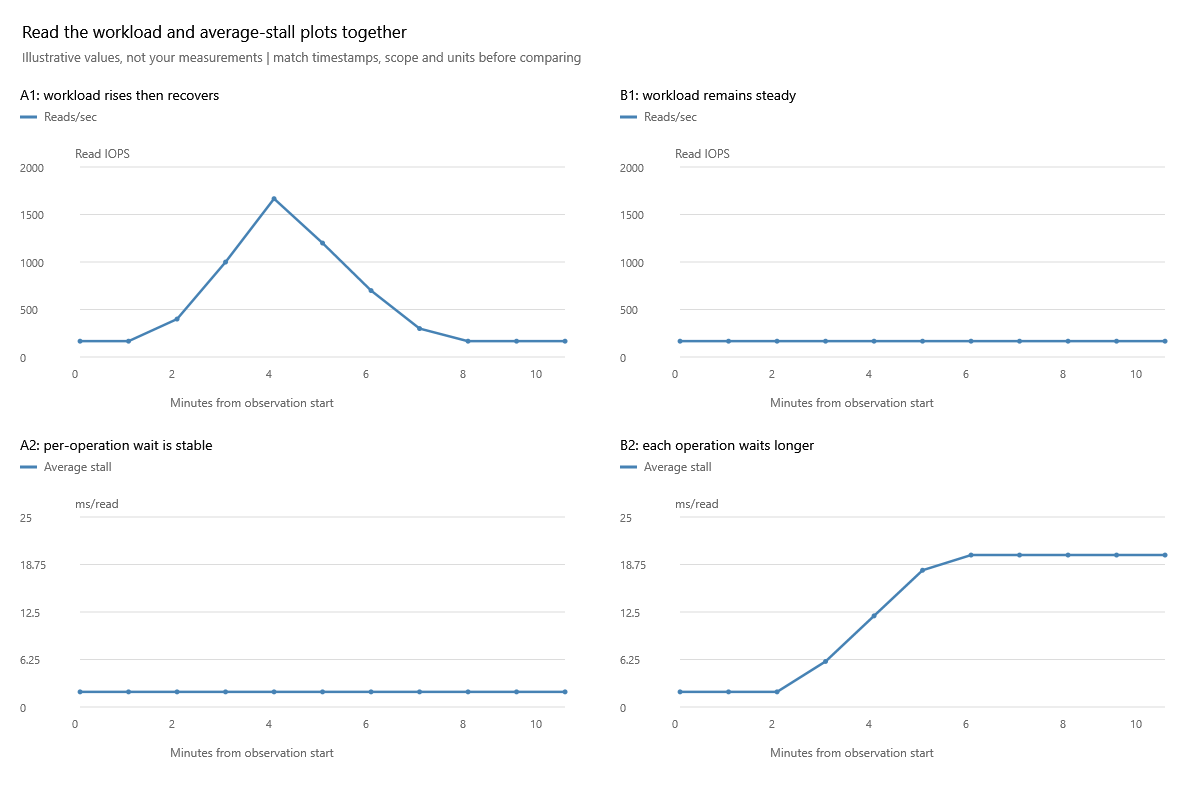
The A column shows more operations with unchanged per-operation wait; B shows steady operations with longer waits. A historical share cannot distinguish these cases. Your next check is the corresponding direction's average stall, followed by file-level/workload evidence, not an assumption that the biggest historical reader owns today's delay.
Definitions: Microsoft file I/O counters.
Documentation revision: 4DFAAAE85E006DCB