
Reading AG Redo Queues
Ask is log arriving faster than this secondary can apply it? Send and redo are different stages. A small send queue does not guarantee that a readable secondary has applied the changes.
Worked example: delivery recovers, redo does not
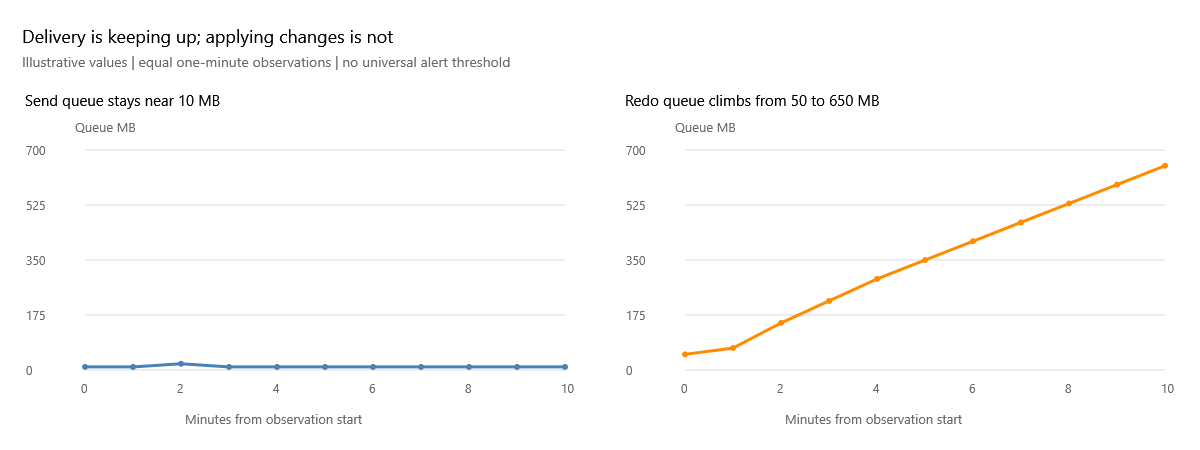
These illustrative charts use the same scale and one-minute observations. Send stays near 10 MB while redo grows from 50 MB to 650 MB over ten minutes. That separates this pattern from the send-backlog example: the backlog is accumulating at the apply stage. It does not identify the exact cause.
Inspect the affected secondary: redo waits/blocking, CPU pressure and data-file I/O are useful follow-up evidence. Check whether data movement is suspended before reasoning about capacity. Compare affected databases and replica peers; a summed replica queue can conceal one database doing nearly all the work. The dashboard cannot establish a specific wait or blocker from queue values alone.
Put a queue into time context
For an illustrative single database with 614,400 KB pending and 10,240 KB/sec redo, division gives 60 seconds. This is a rough queue-processing estimate at that rate with no additional work arriving, not a promised recovery time. If the queue continues growing, the system has not caught up simply because the arithmetic produced a small number.
Use measurements from the same database and relevant time window. Do not divide a multi-database queue total by an unrelated or summed rate and present the result as AG failover time: databases have different rates and can recover concurrently. At zero/unknown rate there is no finite estimate from this formula. Rate fluctuations, continuing arrivals and failover overhead further limit the estimate.
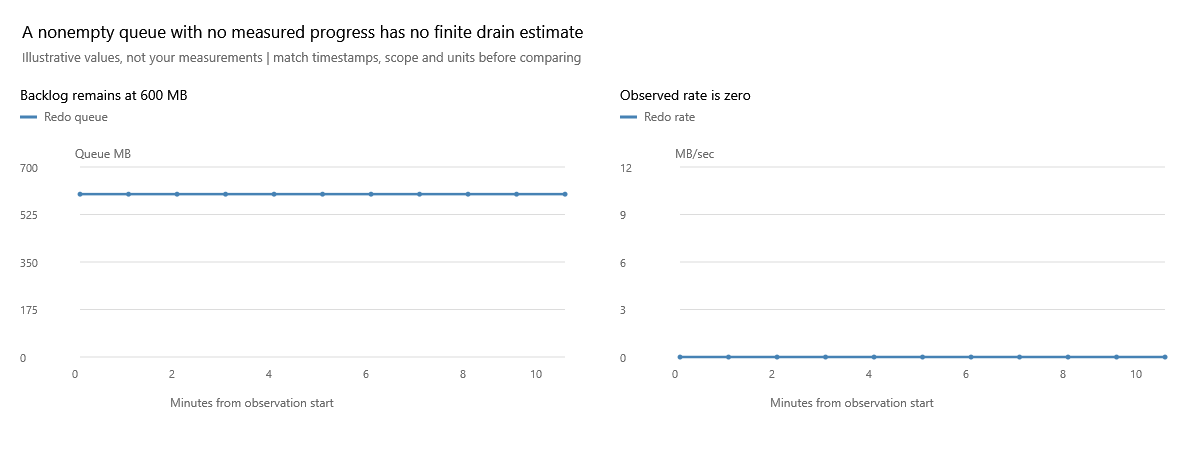
600 MB / 0 MB/sec is undefined, not zero seconds. Check data movement, connection state and whether the rate observation is current before reasoning about a halt. An unavailable rate is also not an observed zero. These graphs cannot identify a blocking session or prove that movement is suspended; obtain that evidence separately.
Watch what happens when more work arrives
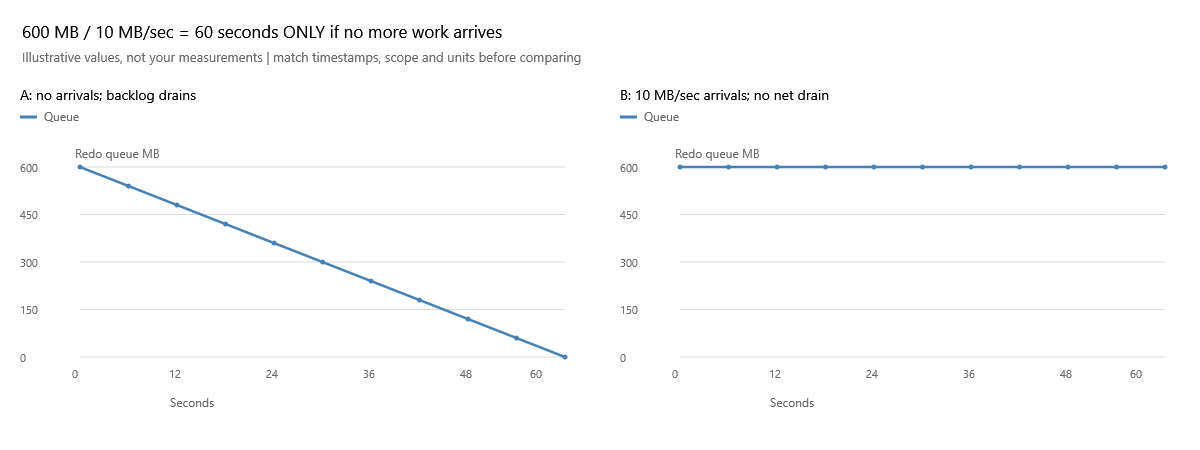
Both cases begin with 600 MB and assume a steady 10 MB/sec redo rate. A receives no more work, so it drains in 60 seconds. B also receives 10 MB/sec, leaving the queue at 600 MB. Dividing the latest queue by its rate still yields 60 seconds in B, but repeatedly performing that arithmetic does not make the backlog disappear. The rate is not net catch-up speed. This is a simplified single-database illustration; use later queue observations to establish whether actual backlog is falling.
Do not turn a replica average into a failover promise
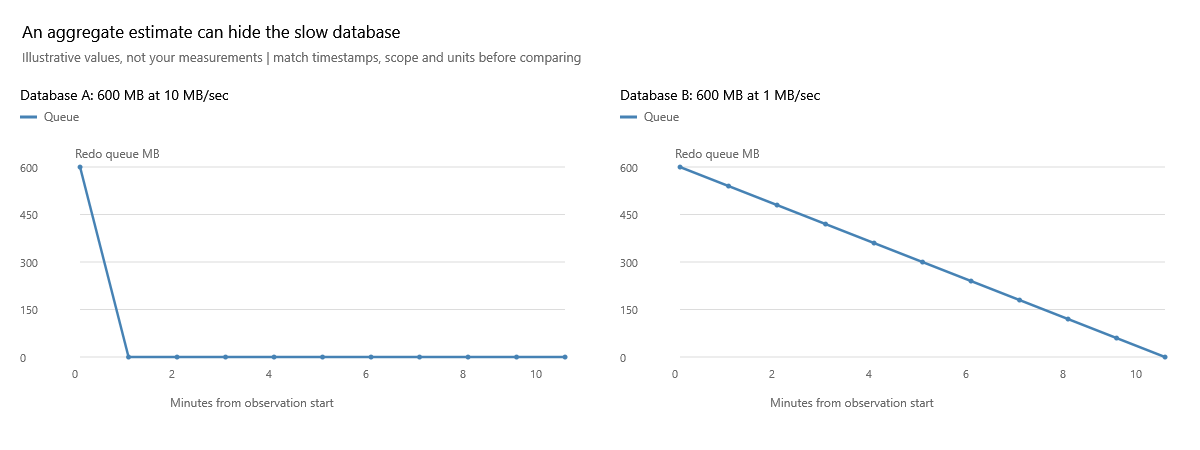
Here A begins with 600 MB and applies 10 MB/sec; B begins with 600 MB and applies 1 MB/sec. With no more arrivals, A finishes in one minute and B in ten. The tempting combined calculation, 1,200 MB / 11 MB/sec, gives about 109 seconds, which hides the slower database. Identify the database driving recovery rather than treating the sum as a guaranteed AG-wide countdown. Even the ten-minute example excludes failover overhead and assumes its rate remains constant.
Recognize recovery
A line that drops from 650 MB toward its usual 50 MB and stays there supports recovery of the backlog. A high redo rate with a still-rising queue does not. Relate the observed drain time to your recovery objective and the readable secondary's freshness requirements. There is no universal queue-size threshold that makes every workload safe.
Use the sustained-recovery versus brief-low illustration for redo as well: the interpretation concerns the shape and persistence of backlog, not which stage owns it. For the next graph, compare send and redo over the same timestamps using the aligned four-panel example, then compare peers. A rising redo queue plus a low send queue directs attention toward applying received work, but you still need live secondary evidence before naming a cause.
Redo queue is not a direct measurement of data-loss exposure. Keep durability, apply progress and connection health separate. Check the snapshot age before deciding any of them are current.
Related: Send queues, synchronization states.
Primary references: Microsoft: redo-queue troubleshooting, Microsoft: recovery-time estimation.
Documentation revision: 32E10ED4BA54EB5A