
Reading AG Synchronization States
The stacked bar answers how are the observed databases distributed across states on this replica? It is not a transfer-progress bar. Its full length represents all observed databases, including those not synchronized.
Worked example: 100% represented is not 100% synchronized
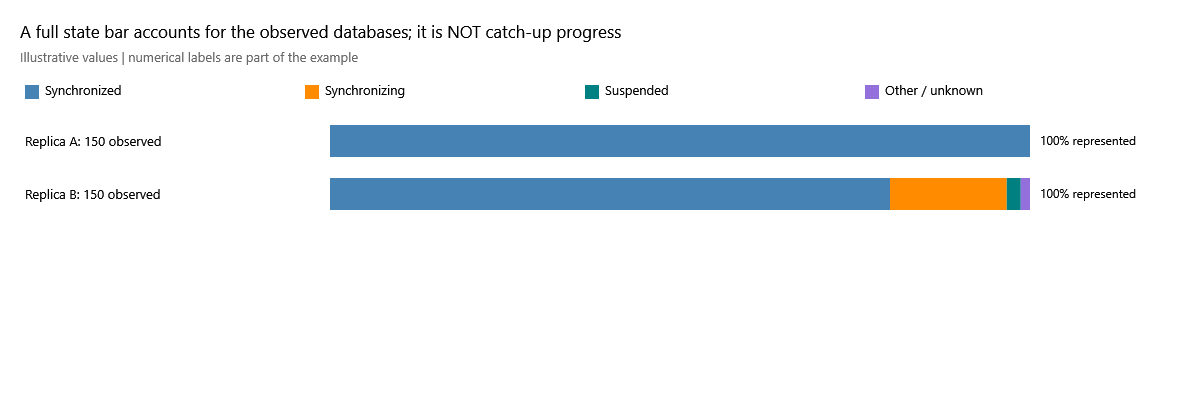
| Replica | Observed databases | Synchronized | Synchronizing | Suspended | Other/unknown |
|---|---|---|---|---|---|
| Replica A | 150 | 150 | 0 | 0 | 0 |
| Replica B | 150 | 120 | 25 | 3 | 2 |
Both full bars total 100%. B is only 80% synchronized: 120 / 150. Its remaining segments are 16.67% synchronizing, 2% suspended and 1.33% other/unknown. Those last five databases can matter much more operationally than their small visual footprint. A critical database does not become unimportant because it occupies less than 1% of the bar.
Use the chart tooltip/drill-down to identify the represented databases, then inspect their state and queue history. Compare the observed count with the expected inventory: missing databases are not included in the denominator and cannot be assumed healthy.
For example, if the expected inventory is 180 databases but only these 150 are observed, another 30 have no represented state. The chart still fills to 100% of the 150 observed rows. Do not silently assign those 30 to synchronized or unknown inside this bar: they are missing coverage, not observed state values. Verify inventory and collection completeness separately. Likewise, 120 synchronized rows could cover many small databases while one large or critical database is suspended; counts do not weight business importance, data size or traffic.
How to decide what deserves attention
Suspended: investigate why movement stopped; do not infer that a small queue makes it harmless. Other/unknown: obtain fresh state rather than treating a neutral segment as success. Synchronizing: compare commit mode and backlog behavior. It can be normal for an asynchronous replica; the label alone is not a catch-up percentage or an incident.
Primary/secondary icons identify roles at the snapshot, not health or historical ownership of every plotted point. History may span a failover. Check the timestamp and selected replica before connecting a role icon to an older event.
Continue with send and redo lessons to distinguish a temporary burst from a sustained backlog.
Follow the state with stage evidence
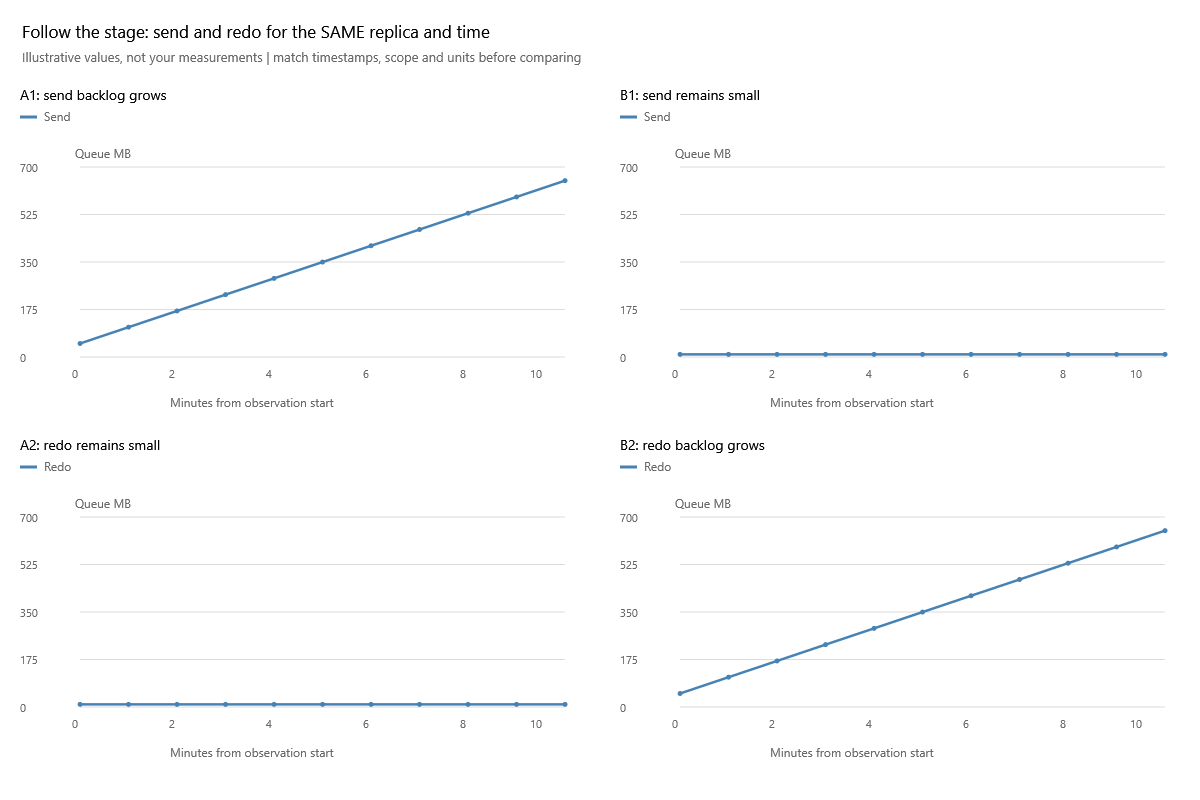
After locating a synchronizing database/replica, compare its queues over the same window. The left column illustrates accumulation before delivery; the right illustrates an apply backlog. Neither picture assigns a percent-complete value to SYNCHRONIZING. Suspended movement or missing connection evidence changes the interpretation, so inspect those states before treating the charts as a pure capacity comparison. The legend's role icon is a snapshot role; if the window spans a failover, corroborate roles at the event rather than using today's crown for the whole history.
Definitions: Microsoft database-replica states.
Documentation revision: D4991A37BFFD3C62