
AG Overview & History
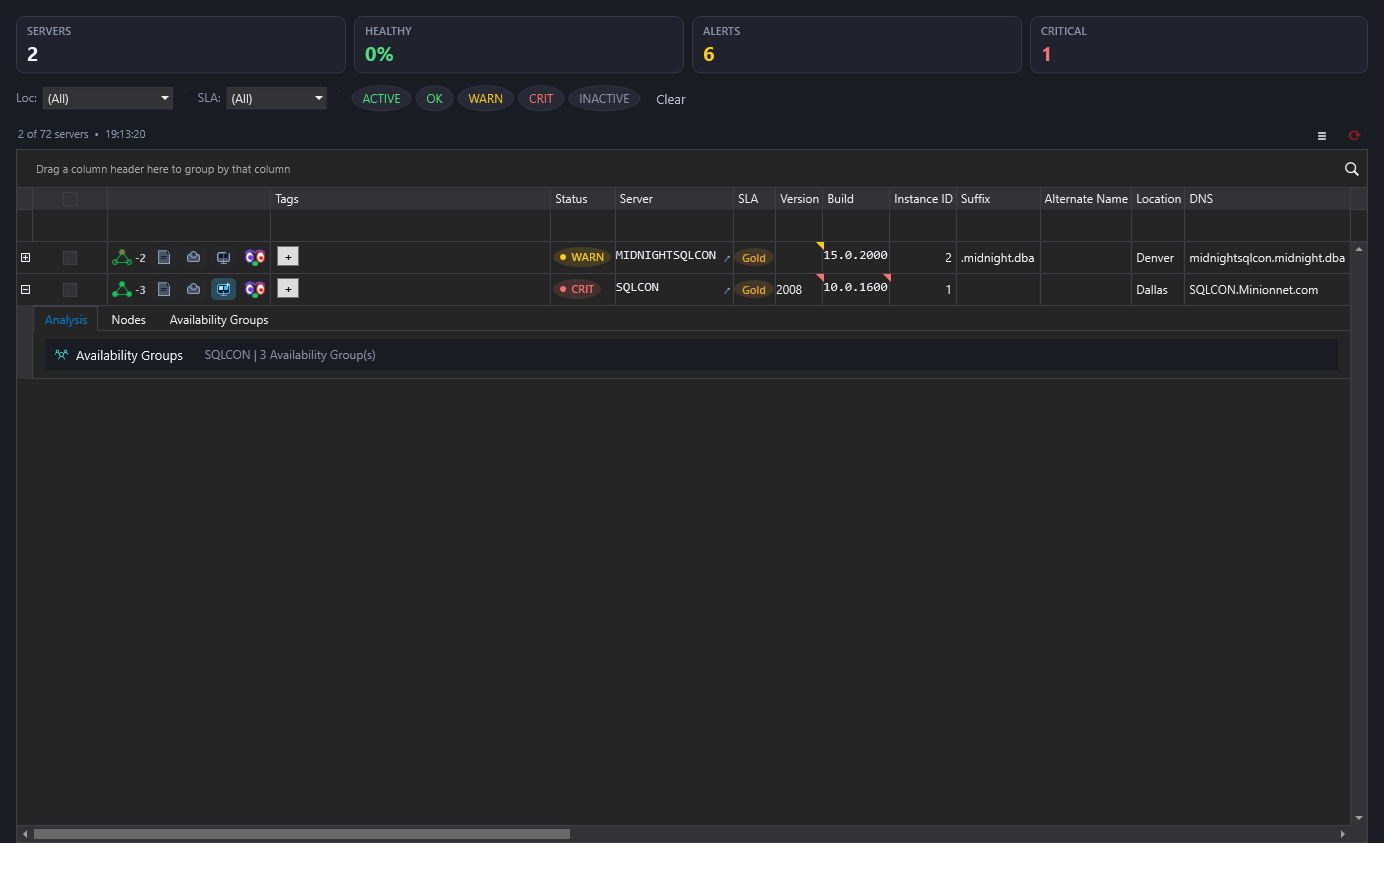
Expand a server in Servers, select Analysis, then click Availability Groups. The row contains a compact launch strip, not an inline dashboard; history loads only after the full-sized window opens. Nodes and Availability Groups remain available as separate detail tabs, including replica navigation. The analysis uses retained observations, not a live query against each replica.
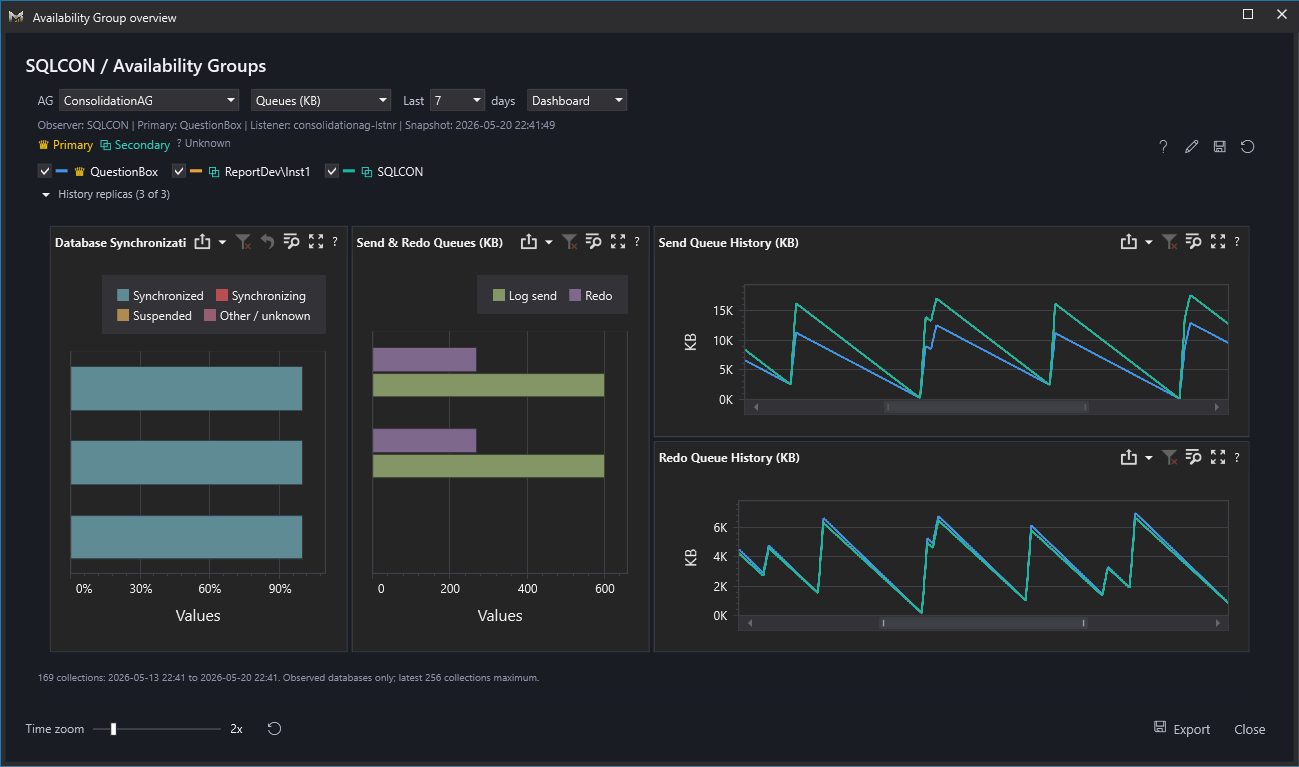
The default Dashboard presentation uses four DevExpress BI charts without the underlying detail table. Choose Classic to retain the earlier three-chart/replica-grid presentation.
Roles & Linked Panels
Reading These Charts
Use the visible ? button for this guide. Each native chart also has its own ? caption button, available even when maximized, for the corresponding lesson. Help from an expanded window opens above that window, not in the disabled main application behind it. Teaching content lives here rather than taking space from the graphs.
- Synchronization states: why a full bar is not full synchronization
- Send queues: a burst that drains versus one that does not
- Redo queues: delivery versus apply, and estimating drain time
Synchronization bars partition observed database states; 100% means all observed databases are represented, not that every database is synchronized or that a transfer is complete. Check the synchronized count and the other state segments. An asynchronous replica can normally remain SYNCHRONIZING; interpret it with commit mode, suspension and queue behavior.
Send queue is unsent log; redo queue is received log still waiting to be applied. A burst that drains differs from a backlog growing across several collections. A suspended database or a persistent backlog deserves investigation. High send/redo throughput alone does not establish a problem, and stale or missing observations cannot establish health. Recovery targets and workload determine which backlog is acceptable.
In the full window, use Time zoom to inspect shorter intervals in both history charts together. Reset restores the full time range. PNG exports show the zoomed view; CSV retains loaded observations.
Definitions: Microsoft replica-state counters.
Replica Roles
Role icons sit beside the server names in the shared history selector: gold crown for Primary, teal overlapping squares for Secondary and a neutral question mark for Unknown. The separate duplicate server-name strip is removed. Role colors identify topology at the latest retained snapshot, not health; the line swatch independently identifies the history series. Hover for role context. Missing or conflicting role observations remain Unknown.
The Dashboard contains Database Synchronization (%), Send & Redo Queues (KB) and separate Send and Redo History charts. Selecting a replica in a snapshot chart filters the other linked charts. The item-caption clear-filter control restores the full selection. Synchronization supports replica-to-database drill-down. History series can filter by replica; a time value is not treated as a replica selection. Database drill-down does not invent database-level measurements in aggregate history.
Synchronization still uses actual retained database observations, not fabricated rows based on aggregate counts. Removing the visible detail table does not change those measurements. Database GUIDs/IDs remain explicit where source names are unavailable.
Arrange & Save
Use the pencil to arrange the four charts in the native layout designer, then Apply layout. Cancel keeps the current arrangement. Saved layouts from earlier versions discard the retired table while preserving chart positions; a legacy combined history slot is divided into Send and Redo. No new data source or query is added.
Apply saves the resulting layout. The save icon also remembers viewer-side resizing; the reset icon restores the default arrangement. Layout-only XML is stored in the existing UserConfig.json under AGDashboardLayout, shared by AG views. It contains no collected rows, server connections or credentials. Layout restoration is validated, size-bounded and disallows DTDs. Chart selections are session interactions, not saved fleet filters. The Classic presentation remains intact.
Snapshot Charts
Select an AG at the top. Its primary, listener, collecting server and snapshot timestamp are shown explicitly.
- Synchronization stacks: each replica bar represents 100% of its observed database-replica rows. Synchronized, synchronizing, suspended and other/unknown are mutually exclusive. A suspended database is counted only in suspended, even when its synchronization state also says synchronizing. Hover a segment for the count, denominator, percentage and collection time. Synchronizing is a state, not automatically a fault: asynchronous replicas can synchronize normally.
- Queue comparison: log-send and redo queues per observed replica, displayed in KB in Dashboard and MB in Classic. These are gauges, not cumulative counters. Missing measurements are unavailable, never fabricated zeros.
- Both charts use the latest retained AG database-replica batch on the selected collecting server. They do not silently substitute another replica's newer report.
Rows are identified by group-database GUID when available, or by the database ID scoped to its collecting server, AG and replica when legacy observations omit that GUID. Duplicate rows in a batch use the latest stored observation.
Retained History
Choose a 1/7/30-day window and Queues (KB) or Rates (KB/sec). Dashboard separates Send and Redo into two charts with one shared replica legend above them. The same replica uses the same color in both charts; changing selections does not reassign colors. Neither chart repeats the long replica/metric legend entries. Hover a line for the replica, timestamp and value.
The compact legend shows up to six replica checkboxes, with full names on hover. Expand History replicas (selected of total) to search the complete checklist, including replicas outside the compact legend. All and None apply to the entire checklist, not just search matches. Clearing all selections leaves both histories empty; it does not silently restore all replicas. These controls affect both history charts together, not the snapshot charts or database rows. The selection carries into the full-panel pop-out and remains in memory for this overview; it is not a saved fleet filter.
Classic retains its single-replica/All observed replicas selector and uses blue for log send and purple for redo. Reported rates are used directly, not calculated by subtracting consecutive samples. Their SQL Server definitions describe active-period averages, not guaranteed instantaneous throughput.
The date window ends at the latest retained observation, which may be old. The actual first/last timestamps are shown; at most 256 complete batches are loaded. No extra baseline is needed for these gauges. A missing replica or measurement at a retained batch breaks the corresponding line instead of connecting through a false zero. A single batch provides snapshot charts but not a history trend. Long intervals with no collection at all remain intervals between observations; the UI cannot infer what happened between them.
In Classic, All observed replicas sums the observed replica values; Dashboard displays separate replica series. Replication copies are separate destinations: totals are not unique workload bytes or server-wide disk I/O. A secondary collector may only observe its own database rows; this does not imply other replicas had zero activity. Unknown health/state coverage remains explicit.
Full Panel & Export
Use the expand icon for the full panel; Dashboard chart clicks perform filtering instead of opening the pop-out. Native Dashboard item-caption buttons maximize individual panels and open data inspection/export actions. Classic chart clicks still expand, and its full panel includes the native replica grid and column chooser. Classic's chart/grid divider is resizable. Its grid shows the latest fleet replica projection, which can have a different collection schedule from history; Dashboard's database rows match the snapshot batch. Use the original Nodes tab to open a replica's server detail.
Export offers a high-resolution PNG of the visible panel and a CSV of retained measurements for the selected AG/replica selection. CSV includes observer, AG, replica, timestamps, exclusive state counts, queue KB and reported rate KB/sec. Missing values are empty. User-controlled names are escaped for spreadsheets. No files are written until choosing an export destination.
The window-level CSV exports retained history for the top-level AG/replica selectors, not transient Dashboard master filters. Use the native dashboard item export to export the interactively filtered item. PNG captures the current visible panel.
Loading & Support
History loads only when the overview is opened. Requests are parameterized by collecting InstanceID and GroupID, limited to two concurrent readers, bounded to 256 batches, and canceled on unload or selection change. Stale responses cannot replace newer selections. The pop-out reuses a loaded snapshot in an independent view model. No separate refresh timer, persistent cache, credentials or custom capturing tooltip is added. Use the existing shared Fleet refresh control to reload the server context.
Diagnostics record instance ID, range, collection counts, open/close/export events and handled failures, not AG/replica names, endpoint URLs, database rows or export destinations. The sample-repository-only Database/Development/SeedAGHistory.sql adds historical observations without changing the latest snapshots; it is never run at GUI startup.
Sources: SQL Server database-replica state and queue/rate semantics, DevExpress WPF Dashboard layout, native Dashboard Designer.
Documentation revision: 0E526E19BE58283C